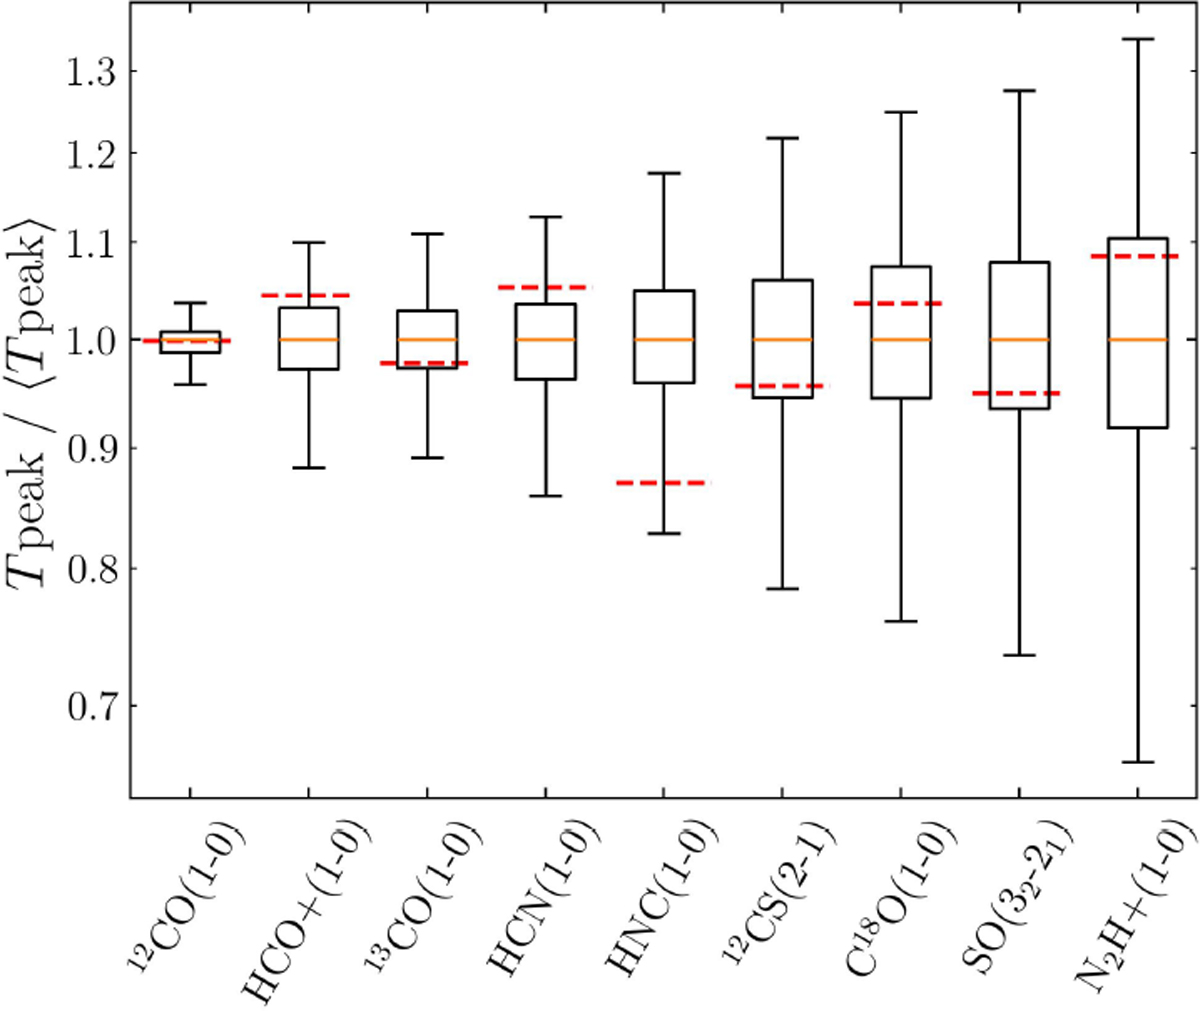
Fig. 5
Download original image
Distribution of the cloud-averaged peak temperature of the 1000 randomly generated toy models (see Sect. 3.1.2). Each boxplot corresponds to an emission line, in a smiliar fashion to Figure 3. The distributions are normalised by their average value. The red dashed lines correspond to the Orion B cloud-averaged values also normalised by the toy clouds’ average values.
Current usage metrics show cumulative count of Article Views (full-text article views including HTML views, PDF and ePub downloads, according to the available data) and Abstracts Views on Vision4Press platform.
Data correspond to usage on the plateform after 2015. The current usage metrics is available 48-96 hours after online publication and is updated daily on week days.
Initial download of the metrics may take a while.