Fig. 1
Download original image
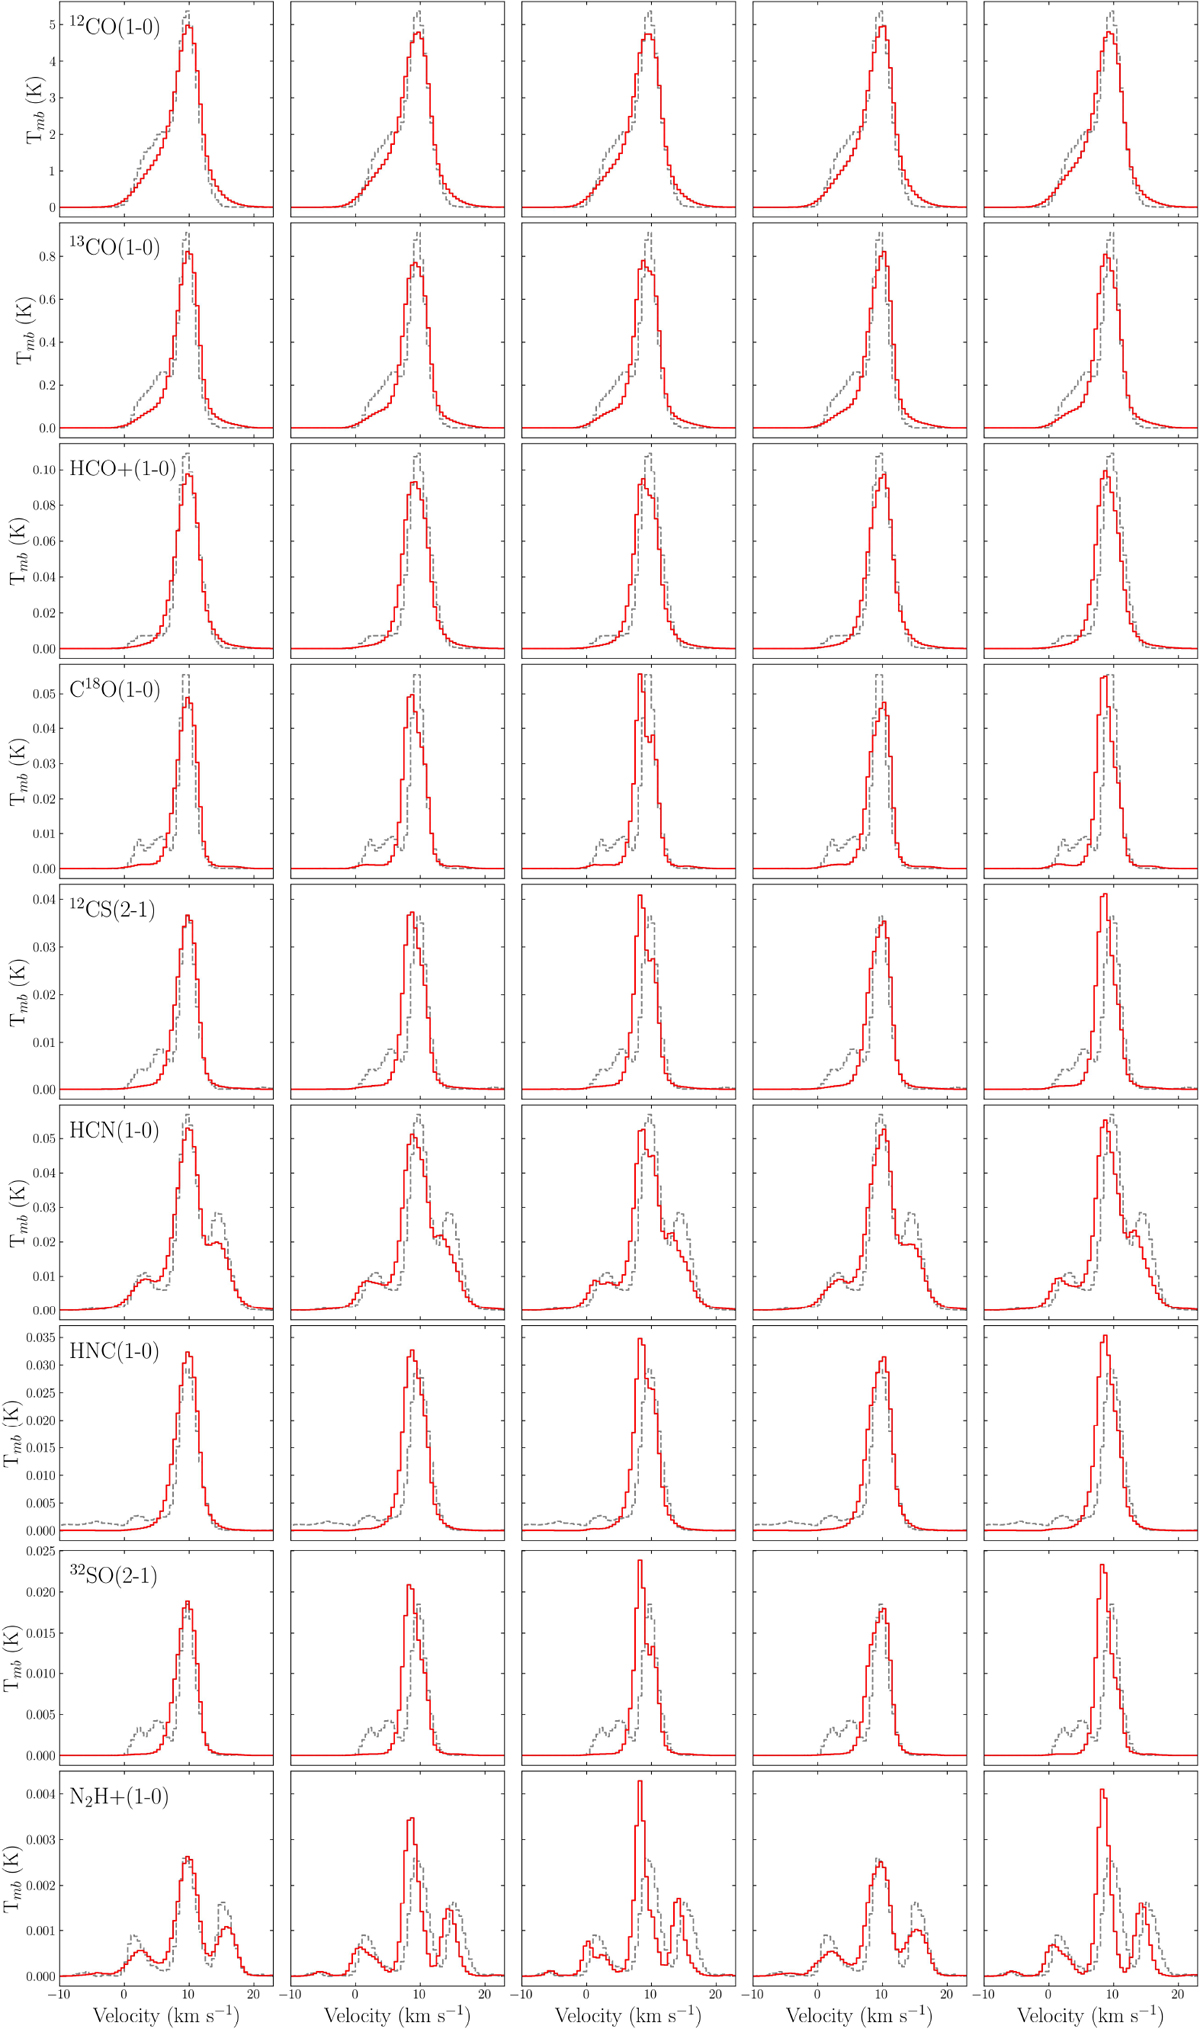
Cloud-averaged spectra of five example toy clouds. Each column corresponds to a cloud and each row to an emission line. The solid red line displays the average spectra of the toy clouds, and the dotted gray line shows the average spectra of ORION-B. The column density and velocity fields corresponding to these toy clouds are shown in Figure 2.
Current usage metrics show cumulative count of Article Views (full-text article views including HTML views, PDF and ePub downloads, according to the available data) and Abstracts Views on Vision4Press platform.
Data correspond to usage on the plateform after 2015. The current usage metrics is available 48-96 hours after online publication and is updated daily on week days.
Initial download of the metrics may take a while.