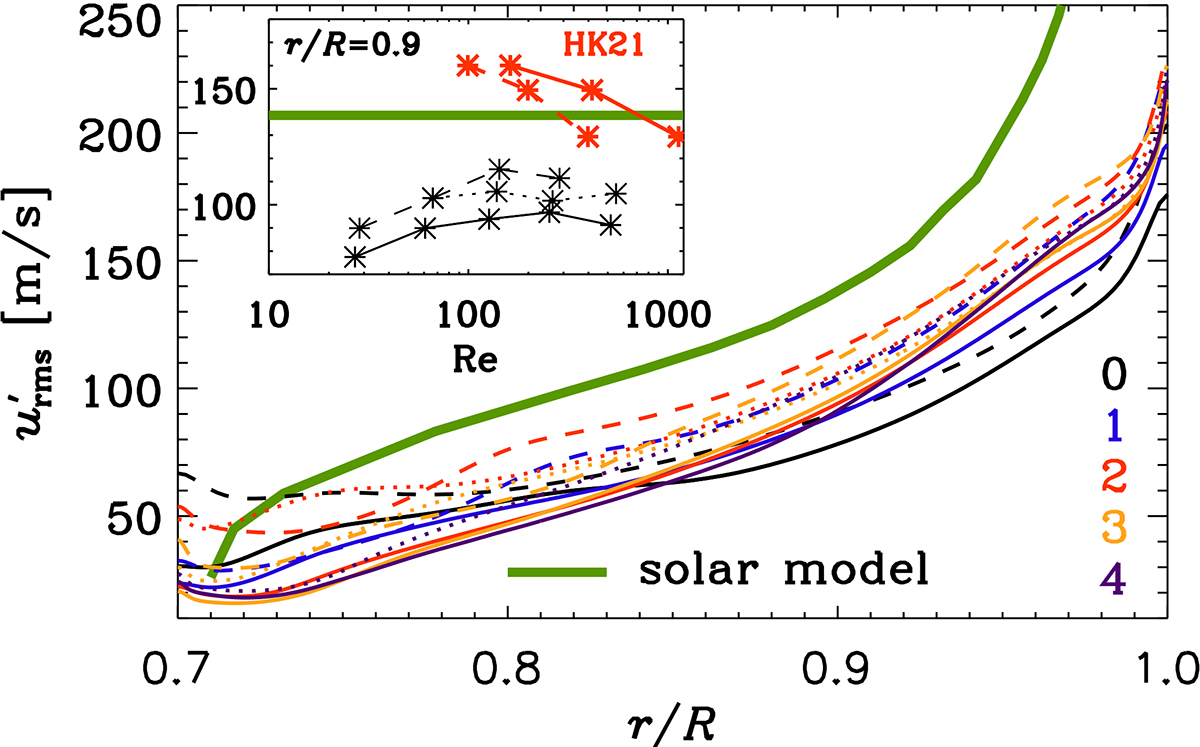
Fig. 6.
Download original image
Radial profile of the latitudinally averaged turbulent velocity urms′ of all runs. The colors indicate the different run sets with different Re as indicated. The solid lines show M runs, the dotted lines show S runs and the dashed lines show H runs, The thick green line indicates the values from the solar model of Stix (2002) based on mixing-length theory. The inset shows urms′ at a fixed radius r = 0.9 R as a function of Re. There, we overplot urms′ of Hotta & Kusano (2021) using the Re estimated in HKS22 (solid red) and a reestimate according to Eq. (16) (dashed).
Current usage metrics show cumulative count of Article Views (full-text article views including HTML views, PDF and ePub downloads, according to the available data) and Abstracts Views on Vision4Press platform.
Data correspond to usage on the plateform after 2015. The current usage metrics is available 48-96 hours after online publication and is updated daily on week days.
Initial download of the metrics may take a while.