Fig. C.1.
Download original image
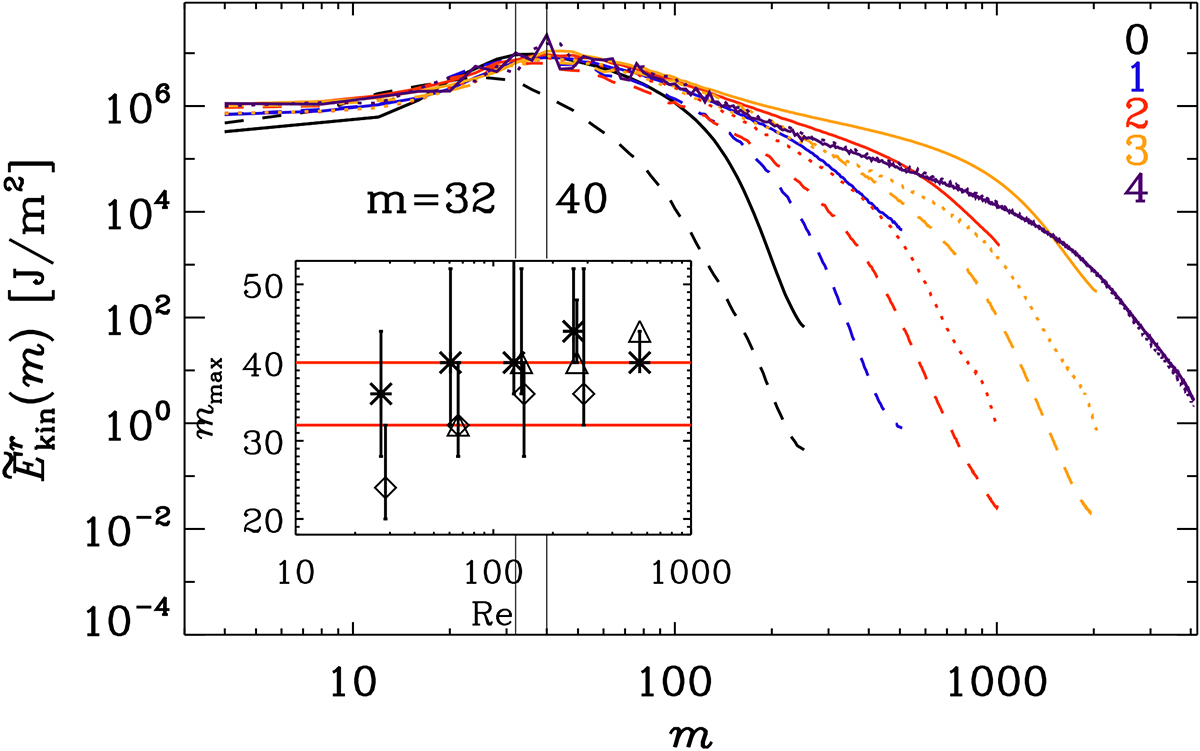
Longitudinal power spectra of the radial kinetic energy density, ![]() , near the surface r = 0.98 R for a narrow latitudinal band around the equator (± 7.5°). The colors indicate the run sets and the line styles/symbols the run type: solid/asterisk (M), dashed/diamonds (H) and dotted/triangles (S). The spectra are averaged over the θ bands and time. The inlay shows the m value of the maxima as a function of Re for all runs. The errors are calculated using an 80% range around the peak. The values m = 32 and m = 40 are indicated by black vertical and (in inlay) red horizontal lines, respectively.
, near the surface r = 0.98 R for a narrow latitudinal band around the equator (± 7.5°). The colors indicate the run sets and the line styles/symbols the run type: solid/asterisk (M), dashed/diamonds (H) and dotted/triangles (S). The spectra are averaged over the θ bands and time. The inlay shows the m value of the maxima as a function of Re for all runs. The errors are calculated using an 80% range around the peak. The values m = 32 and m = 40 are indicated by black vertical and (in inlay) red horizontal lines, respectively.
Current usage metrics show cumulative count of Article Views (full-text article views including HTML views, PDF and ePub downloads, according to the available data) and Abstracts Views on Vision4Press platform.
Data correspond to usage on the plateform after 2015. The current usage metrics is available 48-96 hours after online publication and is updated daily on week days.
Initial download of the metrics may take a while.