Fig. 13.
Download original image
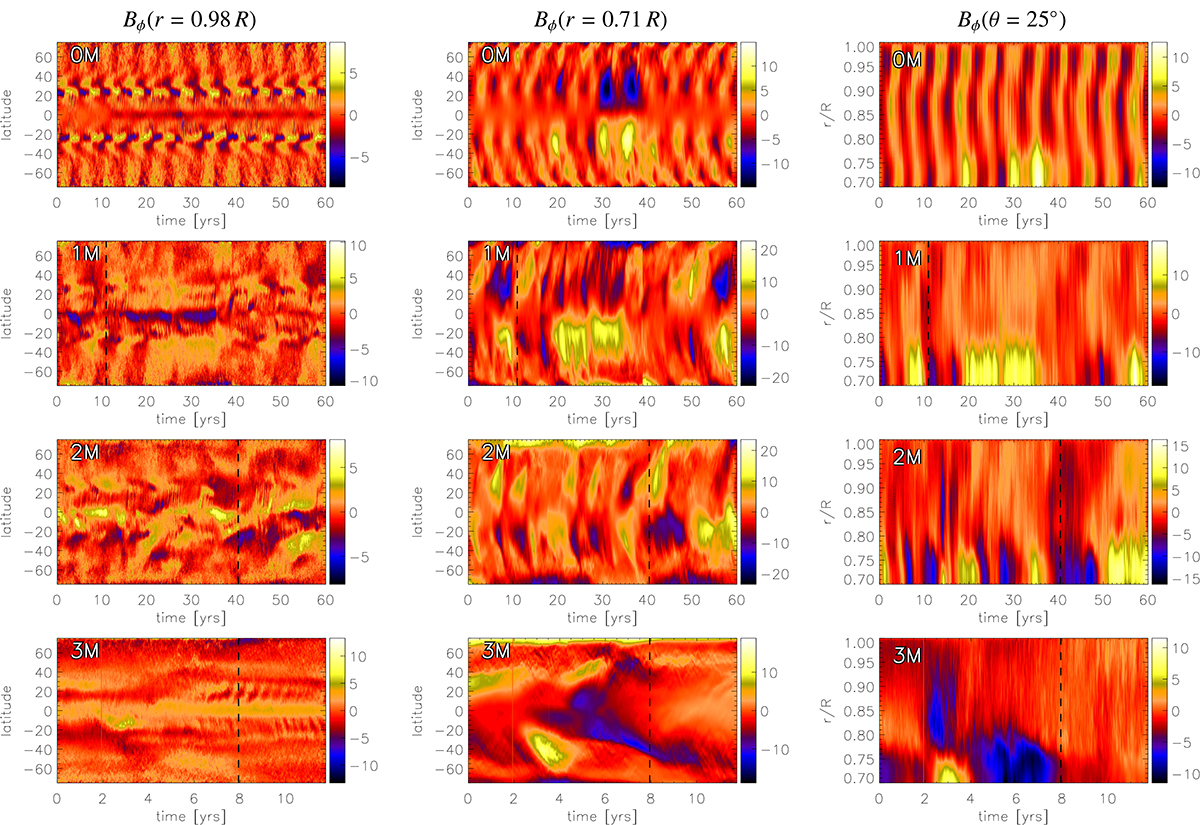
Time evolution of the mean toroidal magnetic field ![]() for all M runs (except 4M and 4M2). We show time-latitude (butterfly) diagrams at r = 0.98 R (first column) and at r = 0.71 R (second column), and the time-radius diagram at 25° latitude (north). We note that the timescale for the first three rows is the same, but is different for the last one. The vertical dashed lines indicate the starting point from which we use a time interval to compute the time averages used in the analysis throughout this paper. The vertical stripes in Run 3M are due to data loss. The mean field is in units of kG.
for all M runs (except 4M and 4M2). We show time-latitude (butterfly) diagrams at r = 0.98 R (first column) and at r = 0.71 R (second column), and the time-radius diagram at 25° latitude (north). We note that the timescale for the first three rows is the same, but is different for the last one. The vertical dashed lines indicate the starting point from which we use a time interval to compute the time averages used in the analysis throughout this paper. The vertical stripes in Run 3M are due to data loss. The mean field is in units of kG.
Current usage metrics show cumulative count of Article Views (full-text article views including HTML views, PDF and ePub downloads, according to the available data) and Abstracts Views on Vision4Press platform.
Data correspond to usage on the plateform after 2015. The current usage metrics is available 48-96 hours after online publication and is updated daily on week days.
Initial download of the metrics may take a while.