Open Access
Fig. A.1
Download original image
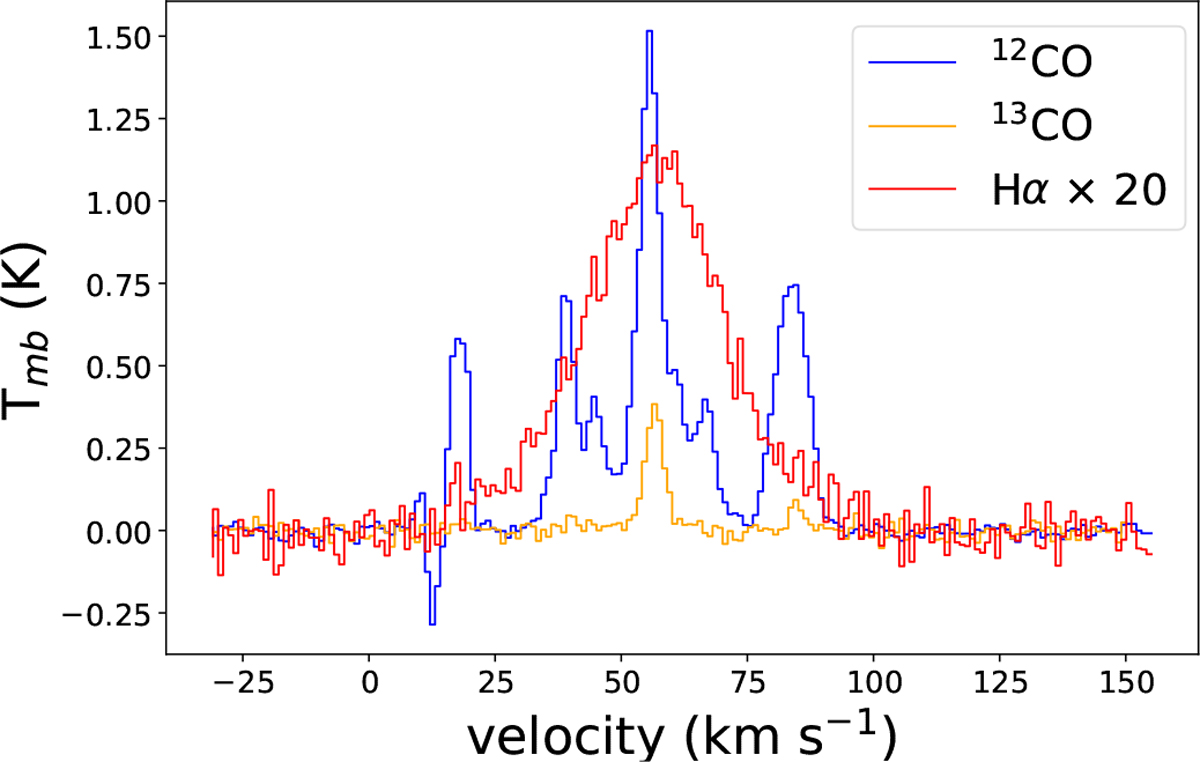
Three mean spectral lines of 12CO (3–2), 13CO (3–2), and Hα RRL are observed in filament G37. The 12CO (3–2) spectrum is represented by the blue line, while the 13CO (3–2) spectrum is depicted by the orange line. Additionally, the Hα RRL spectrum, with its intensity multiplied by 20 times, is shown by the red line.
Current usage metrics show cumulative count of Article Views (full-text article views including HTML views, PDF and ePub downloads, according to the available data) and Abstracts Views on Vision4Press platform.
Data correspond to usage on the plateform after 2015. The current usage metrics is available 48-96 hours after online publication and is updated daily on week days.
Initial download of the metrics may take a while.