Fig. 8
Download original image
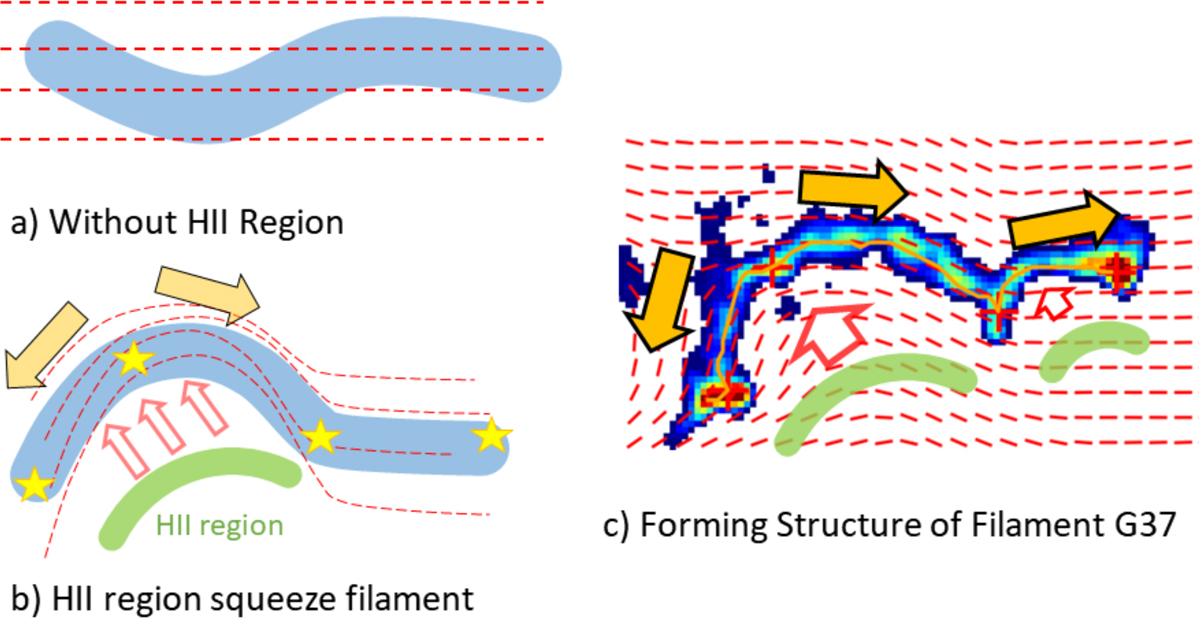
Schematic formation diagram proposed for filament G37. The main structure of filament G37 underwent three evolutionary phases, namely: a) a filament lacking an H II region, b) a filament compressed by an expanding H II region, and c) the formation of filament G37. The structure of the filament is depicted by the blue lines, while the B field is represented by the dashed red lines. The position of the H II region is illustrated by the green graphics. Additionally, the yellow stars and red crosses indicate the locations where star formation was triggered.
Current usage metrics show cumulative count of Article Views (full-text article views including HTML views, PDF and ePub downloads, according to the available data) and Abstracts Views on Vision4Press platform.
Data correspond to usage on the plateform after 2015. The current usage metrics is available 48-96 hours after online publication and is updated daily on week days.
Initial download of the metrics may take a while.