Fig. 7
Download original image
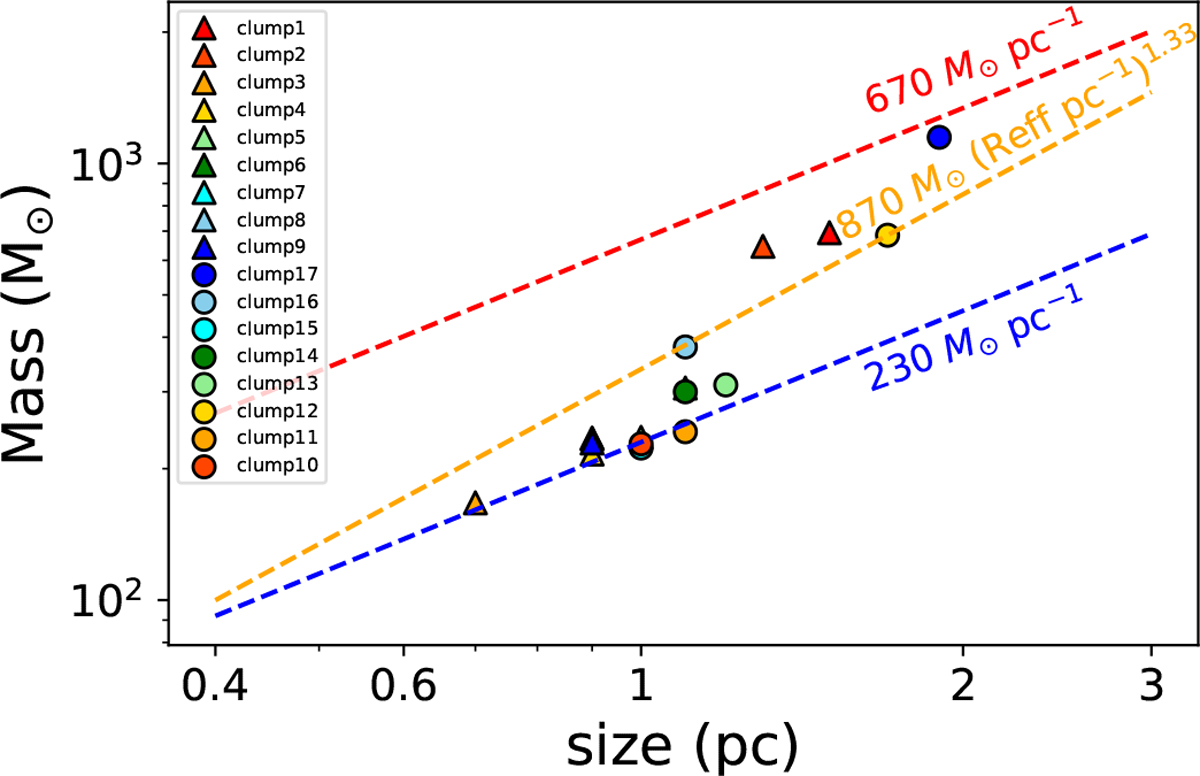
Size and mass of clumps depicted using colored circles and triangles, as shown in Fig. E.1, on the size-mass map. The size refers to the effective diameter of the clumps, which is twice the effective radius. The red and blue dotted lines represent the line masses of 230 and 670 M⊙ pc−1 respectively, which serve as representative values for non-star-forming and star-forming filaments (Li et al. 2016). The orange lines illustrate the relationship associated with massive star formation (Kauffmann et al. 2010).
Current usage metrics show cumulative count of Article Views (full-text article views including HTML views, PDF and ePub downloads, according to the available data) and Abstracts Views on Vision4Press platform.
Data correspond to usage on the plateform after 2015. The current usage metrics is available 48-96 hours after online publication and is updated daily on week days.
Initial download of the metrics may take a while.