Fig. 6
Download original image
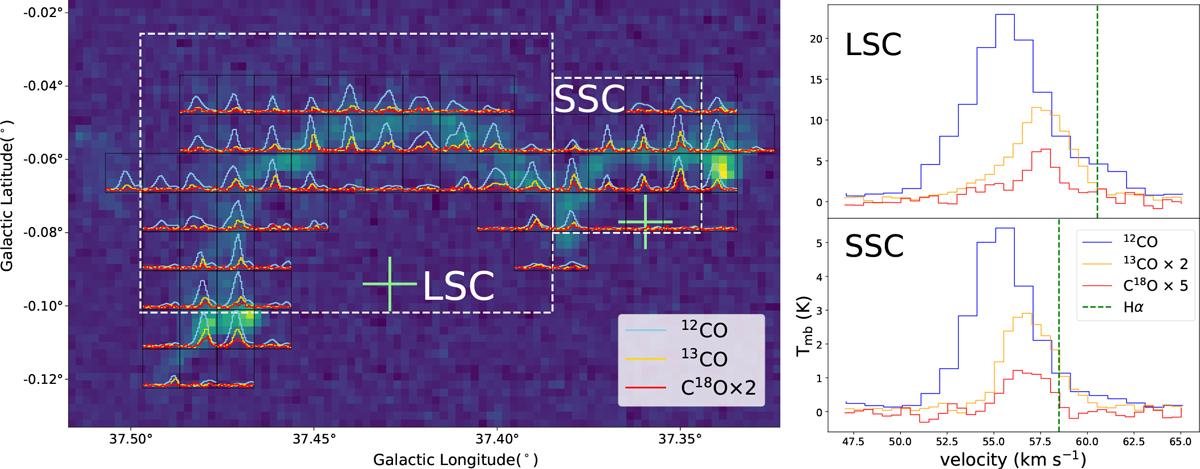
Spectral line shapes of four tracers depicted in filament G37. The spectra contours of 12CO, 13CO, and C18O (3–2) are represented by the blue, yellow, and red lines, respectively, within each block (30ʺ × 30ʺ). The velocity range for these lines is from 47 to 65 km s−1. The background displays the intensity map of 13CO (3–2) at a velocity range of [47,65] km s−1. The right panels display the spectral lines of the large semicircle (LSC) and small semicircle (SSC), which cover the region shown in the left panel. The central velocities of the Hα RRL lines, indicated by the green cross in the left panel, are marked by dotted vertical lines. Each spectral line is distinguished by its respective color.
Current usage metrics show cumulative count of Article Views (full-text article views including HTML views, PDF and ePub downloads, according to the available data) and Abstracts Views on Vision4Press platform.
Data correspond to usage on the plateform after 2015. The current usage metrics is available 48-96 hours after online publication and is updated daily on week days.
Initial download of the metrics may take a while.