Fig. 5
Download original image
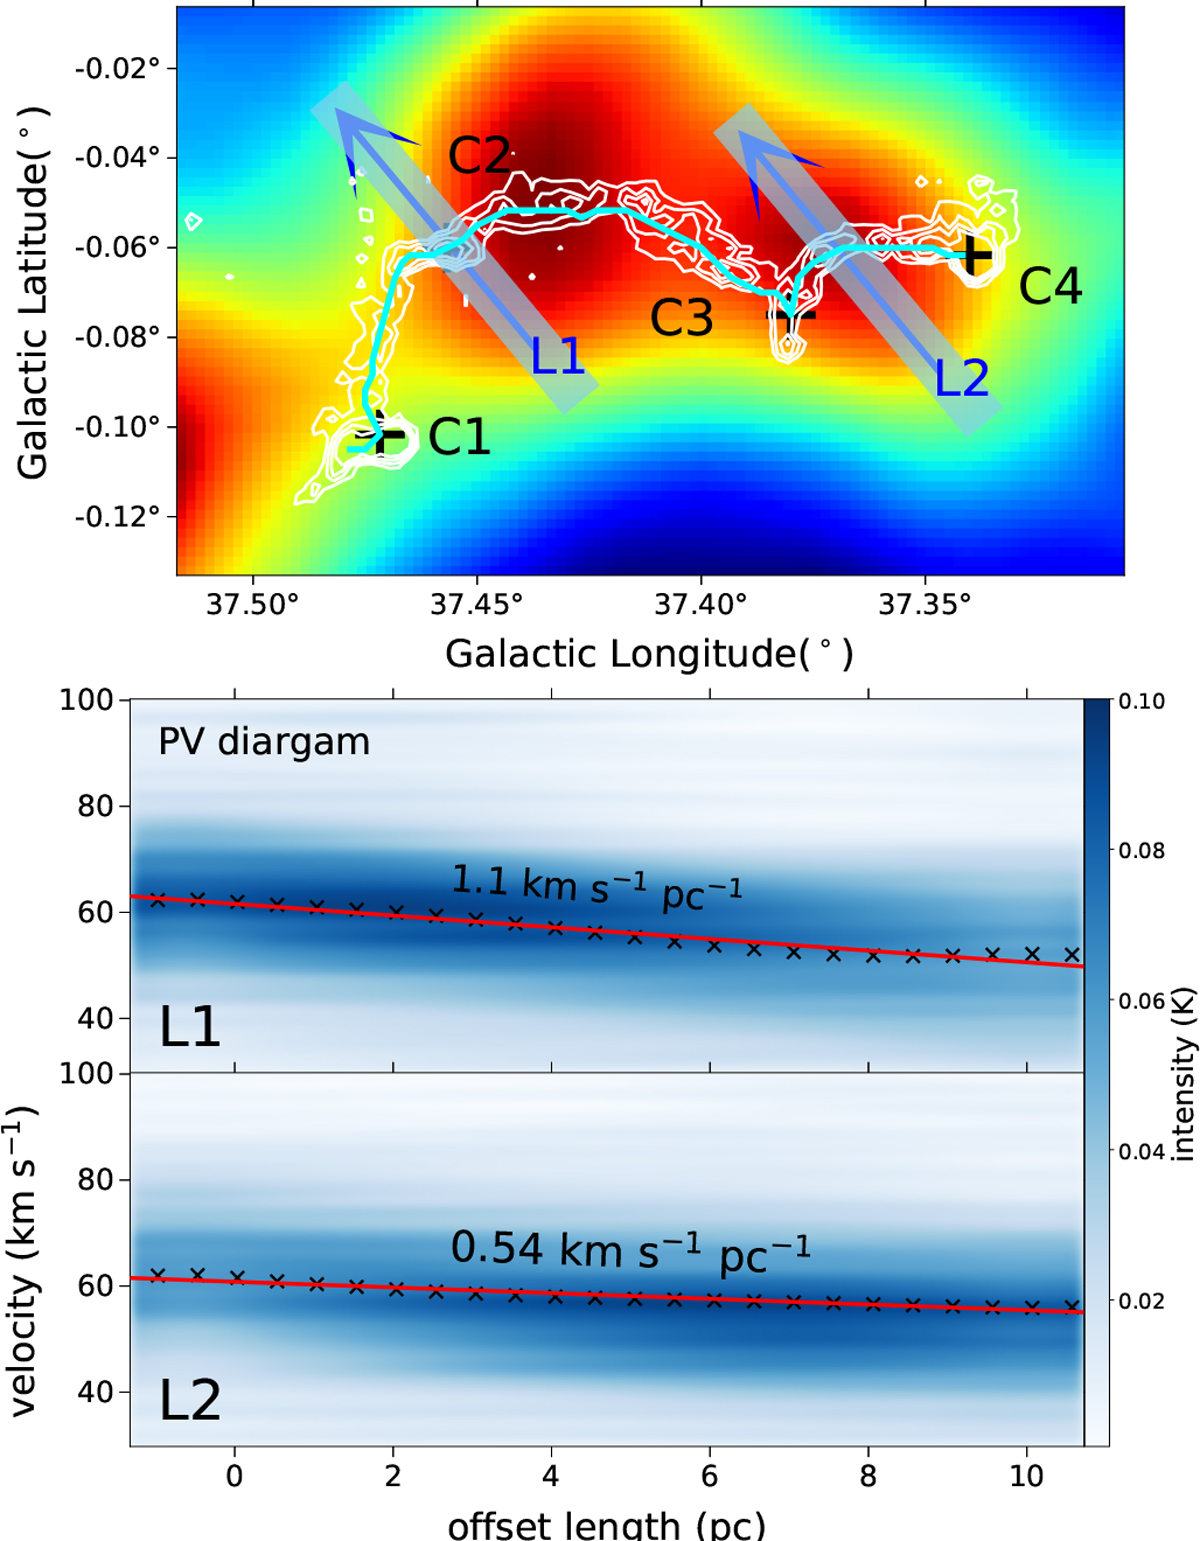
Position–velocity diagram obtained from Hα RRL observations. In the top panel, the intensity map of Hα RRL emission is displayed in the background, with the filament shape depicted by white contours (same as Fig.1). The filament skeleton is represented by a cyan line. Four key points of filament G37, as shown in Fig.1, are marked by black crosses. The P–V diagrams are derived from two blue lines, namely L1 (middle panel) and L2 (bottom panel), which pass through the top points of the two semicircles. The velocity gradient of the Hα RRL emission is indicated by red lines in the bottom panels, and is obtained by fitting the weighted velocity positions (refer to the black cross in the middle and bottom panels).
Current usage metrics show cumulative count of Article Views (full-text article views including HTML views, PDF and ePub downloads, according to the available data) and Abstracts Views on Vision4Press platform.
Data correspond to usage on the plateform after 2015. The current usage metrics is available 48-96 hours after online publication and is updated daily on week days.
Initial download of the metrics may take a while.