Fig. 4
Download original image
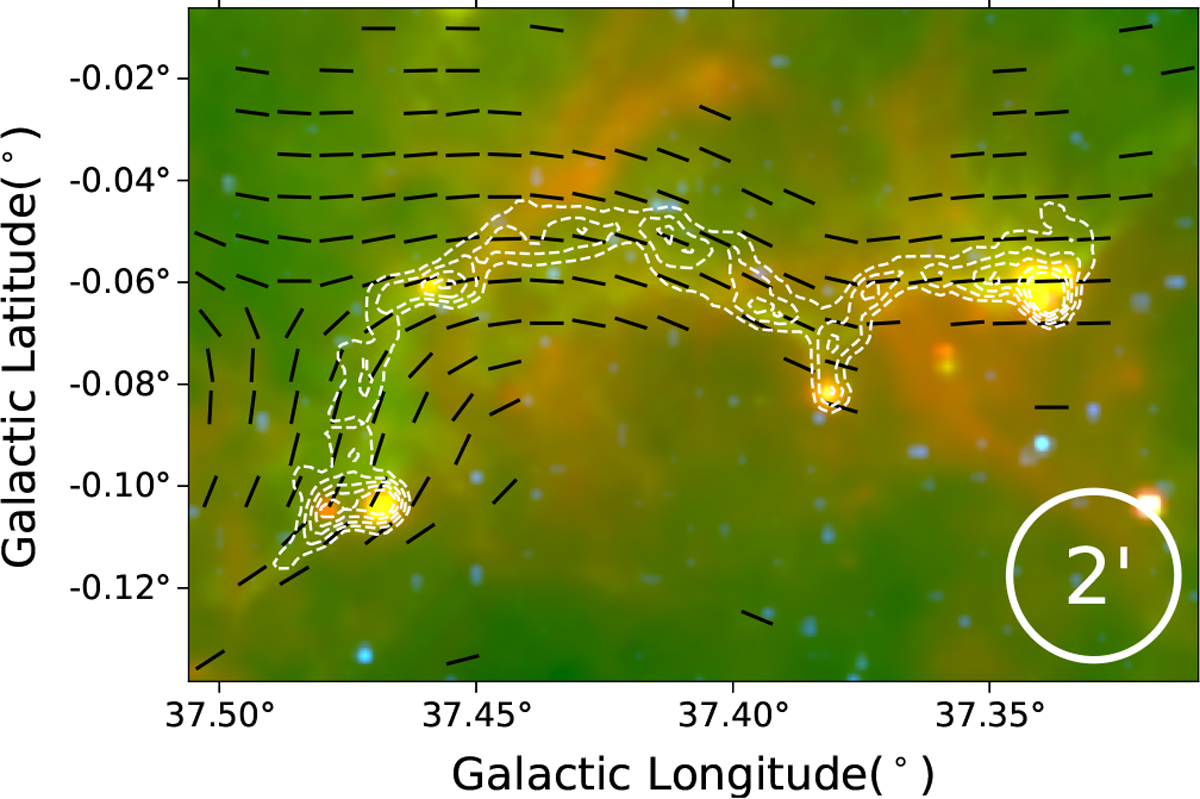
Magnetic field structure of filament G37 revealed with VGT measurements of 12CO. The orientation of the magnetic field is represented as black vectors. The intensity map of filament G37, derived from 13CO emission, is depicted as white contours (same as Fig. 1). The background of the image corresponds to a mid-infrared three-color map, consistent with Fig. 1. The spatial resolution of the magnetic field measurement using VGT is ~2ʹ, as indicated by a white circle in the bottom-right corner.
Current usage metrics show cumulative count of Article Views (full-text article views including HTML views, PDF and ePub downloads, according to the available data) and Abstracts Views on Vision4Press platform.
Data correspond to usage on the plateform after 2015. The current usage metrics is available 48-96 hours after online publication and is updated daily on week days.
Initial download of the metrics may take a while.