Fig. 3
Download original image
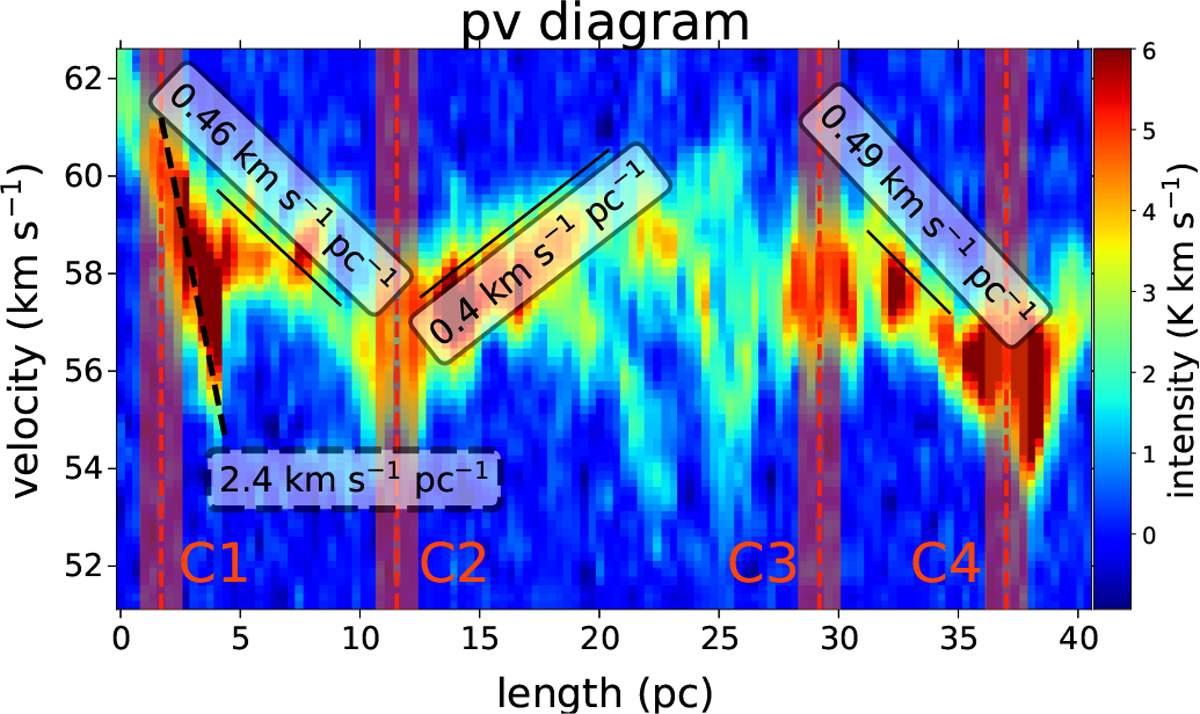
Position-velocity (P-V) diagram to illustrate the distribution of filament G37, obtained from 13CO emission. The distribution is shown along the filament skeleton, as depicted in Fig. 2, with the dense clumps C1, C2, C3, and C4 (as shown in Fig. 1) represented by the red columns. The x-axis denotes the filament length in unit as pc, while the y-axis shows the velocity, VLSR. The diagram shows vertical dashed red lines for the locations of four dense clumps (C1–C4) and black lines for the velocity gradients. The extra velocity gradient of clump C1 is shown as a dashed line.
Current usage metrics show cumulative count of Article Views (full-text article views including HTML views, PDF and ePub downloads, according to the available data) and Abstracts Views on Vision4Press platform.
Data correspond to usage on the plateform after 2015. The current usage metrics is available 48-96 hours after online publication and is updated daily on week days.
Initial download of the metrics may take a while.