Fig. 2
Download original image
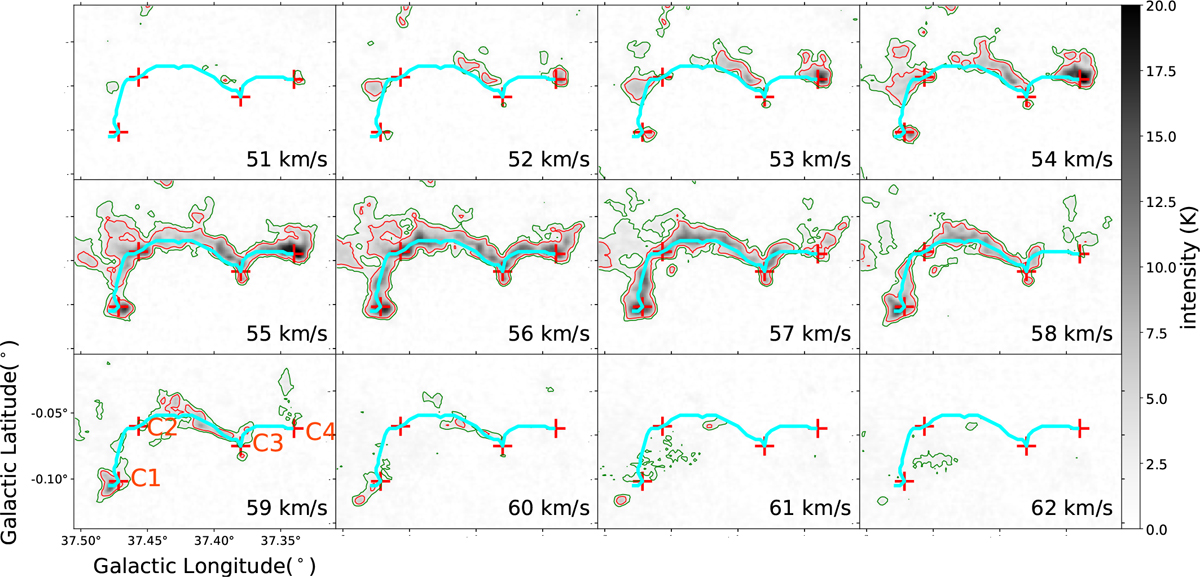
Channel maps of 12CO and 13CO (3–2) emissions for filament G37. The intensity of the 12CO and 13CO (3–2) lines within the velocity range of 51 to 62 km s−1 is depicted by green and red contours, respectively, with a step of 1 km s−1. These contours represent regions where the signal-to-noise ratios of 12CO and 13CO exceed 6σ of the spectral lines, which correspond to approximately 1.9 and 2.1 K km s−1, respectively. The intensity distribution of 12CO emission for each velocity channel is displayed as the gray background of the maps. The skeleton of filament G37 is represented by a cyan line, while four special dense clumps (C1–C4) are denoted by red crosses, which are consistent with those shown in Fig. 1.
Current usage metrics show cumulative count of Article Views (full-text article views including HTML views, PDF and ePub downloads, according to the available data) and Abstracts Views on Vision4Press platform.
Data correspond to usage on the plateform after 2015. The current usage metrics is available 48-96 hours after online publication and is updated daily on week days.
Initial download of the metrics may take a while.