Open Access
Fig. D.1
Download original image
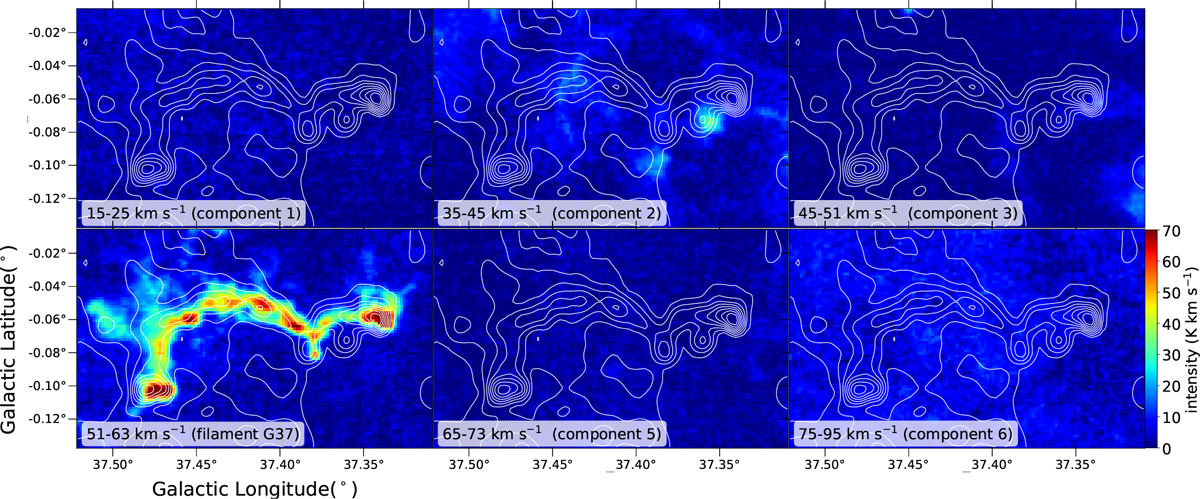
Velocity-integrated intensity maps of 12CO for each velocity component (see Fig. C.1) are presented in the background. The white contours show the H2 column density, ranging from 1022 to 1022.4 cm−2 with a step of 100.05 cm−2 (Zucker et al. 2018).
Current usage metrics show cumulative count of Article Views (full-text article views including HTML views, PDF and ePub downloads, according to the available data) and Abstracts Views on Vision4Press platform.
Data correspond to usage on the plateform after 2015. The current usage metrics is available 48-96 hours after online publication and is updated daily on week days.
Initial download of the metrics may take a while.