Fig. 1
Download original image
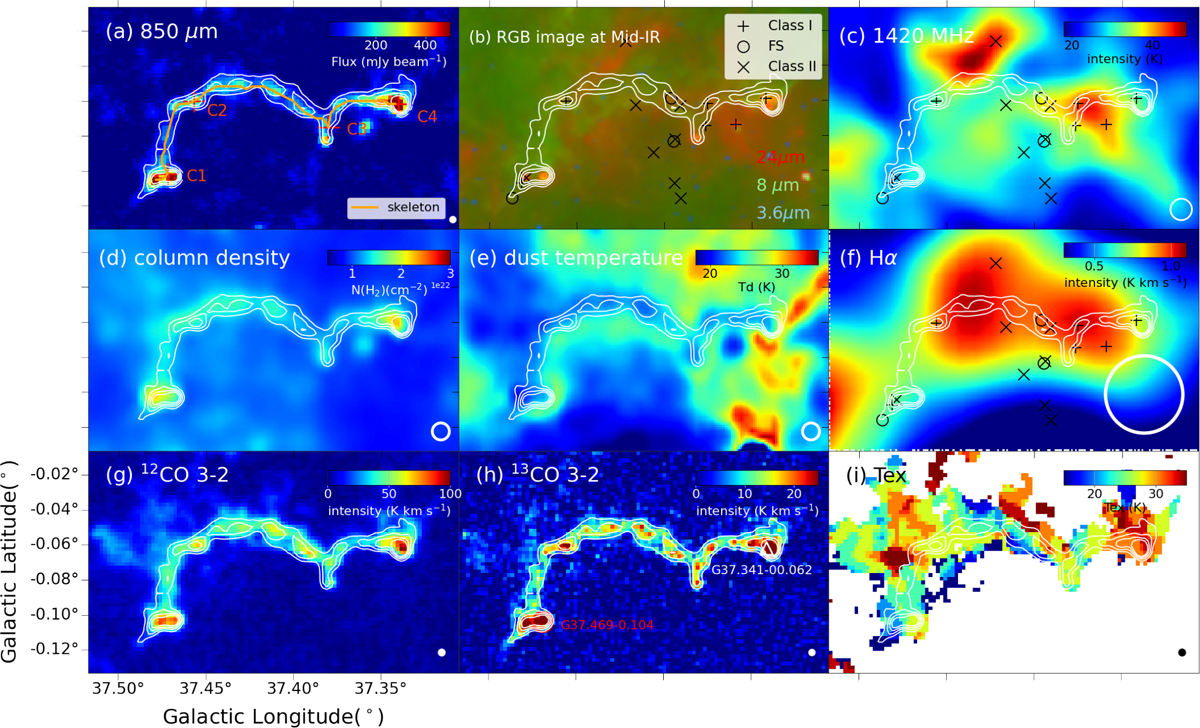
Structure of filament G37. Panels a, b, and c display the structure of filament G37 at different wavelengths. Panel a presents the submillimeter wavelength emission at 850 μm (Eden et al. 2017). The orange line displays the skeleton of filament G37, which is identified in Li et al. (2016). Four special dense clumps (C1–C4) are denoted by red crosses (see Sect. 3.1). The RGB image at the mid-infrared (Spitzer, GLIMPSE Benjamin et al. 2003; MIPSGAL Carey et al. 2009) is shown in panel b, where red represents 24 μm, green represents 8 μm, and blue represents 3.6 μm. Panel c displays the distribution of continuum emission at 1420 MHz from VGPS (Stil et al. 2006). The cross markers in panels b and c display the position of the young stellar objects (YSOs; Kuhn et al. 2021), which are derived from the mid-infrared range of 3–9 μm obtained from the Spitzer telescope. Panels d and e display the distribution of H2 column density and dust temperature (Zucker et al. 2018). The integrated intensity maps of Hα RRL, 12CO (3–2), and 13CO (3–2) emissions from a velocity of 51 to 62 km s−1 are shown in the panels f, g, and h, respectively. The white contours in all panels show the integrated intensity of 13CO (3–2) from 3 to 15 K km−1 with steps of 3 K km−1. The distribution of excitation temperature derived from 12CO (3–2) emission is shown in panel (i). The spatial resolution of each panel is shown in the lower-right corner.
Current usage metrics show cumulative count of Article Views (full-text article views including HTML views, PDF and ePub downloads, according to the available data) and Abstracts Views on Vision4Press platform.
Data correspond to usage on the plateform after 2015. The current usage metrics is available 48-96 hours after online publication and is updated daily on week days.
Initial download of the metrics may take a while.