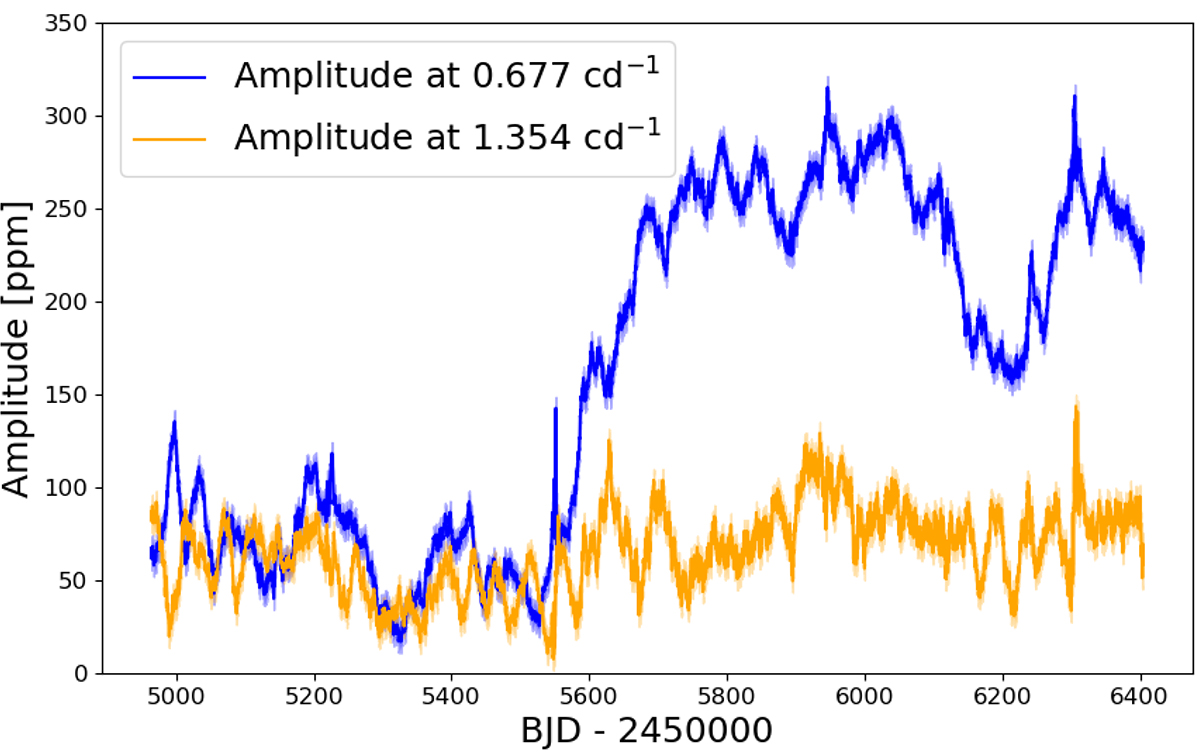
Fig. 9.
Download original image
Amplitude variability of the spike and its harmonic (Kepler data). Amplitudes of the spike frequency (blue) and its first harmonic (orange), determined from 19-day windows based on the time-dependent amplitude spectrum shown in Fig. 7. The more transparent blue and orange bands represent the analytical uncertainties in amplitude, respectively.
Current usage metrics show cumulative count of Article Views (full-text article views including HTML views, PDF and ePub downloads, according to the available data) and Abstracts Views on Vision4Press platform.
Data correspond to usage on the plateform after 2015. The current usage metrics is available 48-96 hours after online publication and is updated daily on week days.
Initial download of the metrics may take a while.