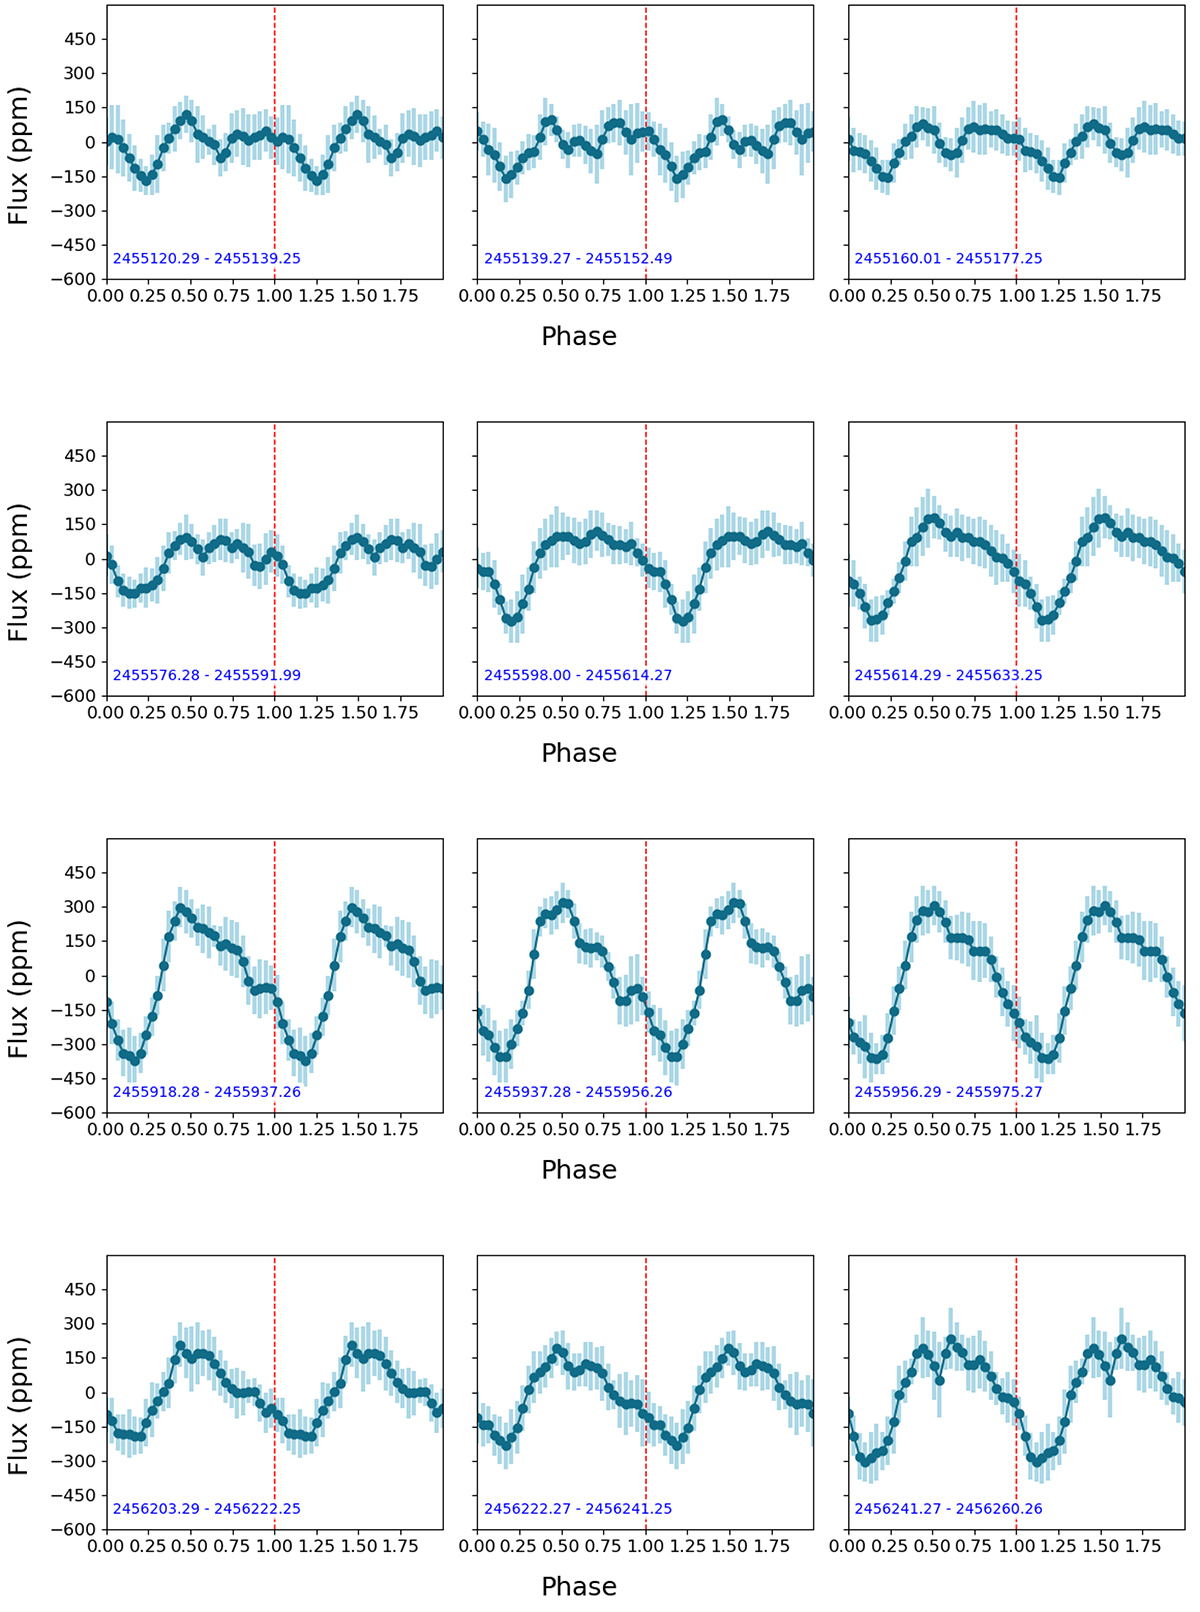
Fig. 8.
Download original image
Kepler data: selected subsets. Each panel shows data combined over a 19-day interval and binned into 30 equal segments. The data in each row are nearly continuous, with the exception of a 7–8 day gap between the second and third panels in the first row and between the first and second panels in the second row. Petrol-blue points represent the binned data, with error bars indicating the standard deviation within each bin.
Current usage metrics show cumulative count of Article Views (full-text article views including HTML views, PDF and ePub downloads, according to the available data) and Abstracts Views on Vision4Press platform.
Data correspond to usage on the plateform after 2015. The current usage metrics is available 48-96 hours after online publication and is updated daily on week days.
Initial download of the metrics may take a while.