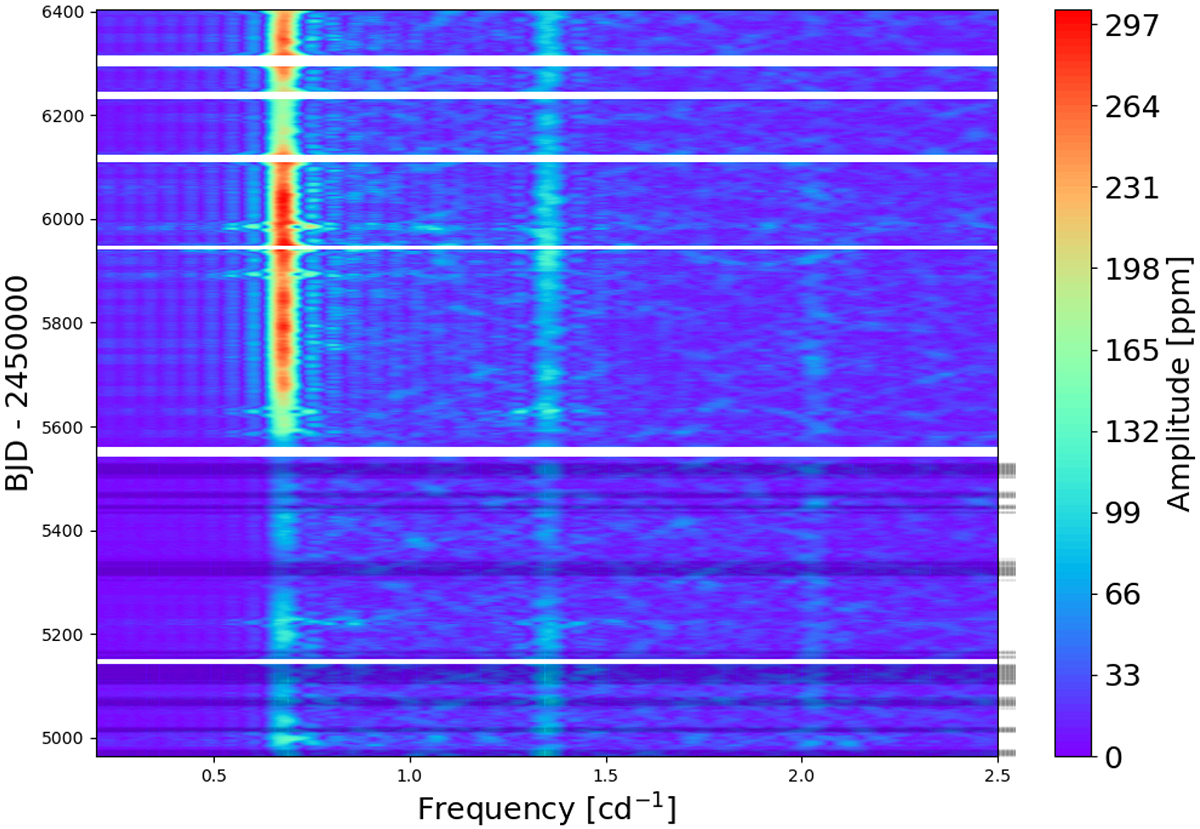
Fig. 7.
Download original image
Time-resolved Lomb-Scargle analysis of the Kepler data. A sliding window of 19 days was used, with each window shifted by a step size of 0.2 days. The horizontal black lines and the ticks on the right side of the diagram indicate time steps where the amplitude of the first harmonic exceeds that of the fundamental, supporting the interpretation of stellar spots. No significant signal is observed beyond 2.5 cd−1.
Current usage metrics show cumulative count of Article Views (full-text article views including HTML views, PDF and ePub downloads, according to the available data) and Abstracts Views on Vision4Press platform.
Data correspond to usage on the plateform after 2015. The current usage metrics is available 48-96 hours after online publication and is updated daily on week days.
Initial download of the metrics may take a while.