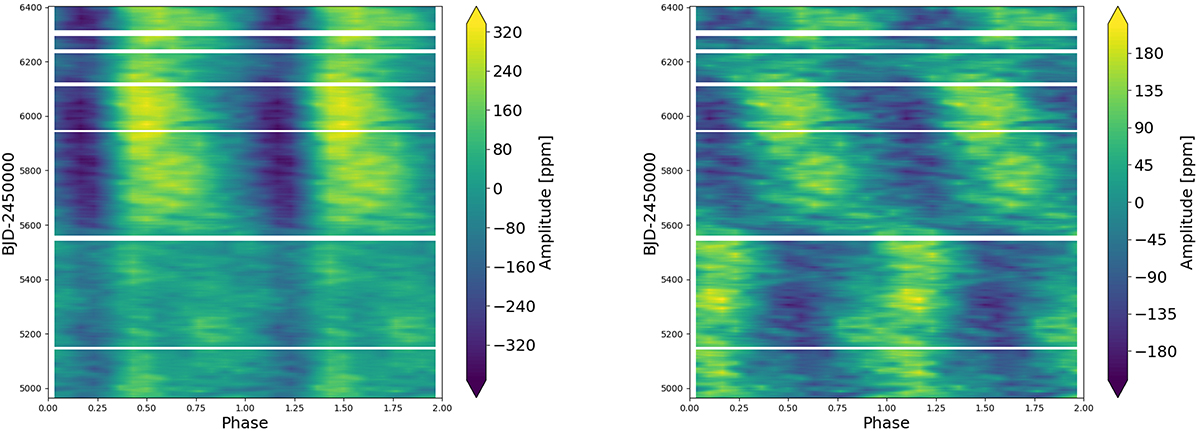
Fig. 6.
Download original image
Kepler data: time-dependent phase plot showing the dynamic changes in the phase-folded light curve. The analysis window is 19 days long, shifted by steps of 0.2 days. White areas indicate regions where the data coverage in a given window is less than 70%. The left panel displays the phase-folded light curve as a function of time, revealing temporal variations. In the right panel, we subtract the average phase-folded light curve (computed from the entire Kepler dataset) from each windowed phase-folded light curve to highlight the temporal variability. See the text for additional details.
Current usage metrics show cumulative count of Article Views (full-text article views including HTML views, PDF and ePub downloads, according to the available data) and Abstracts Views on Vision4Press platform.
Data correspond to usage on the plateform after 2015. The current usage metrics is available 48-96 hours after online publication and is updated daily on week days.
Initial download of the metrics may take a while.