Open Access
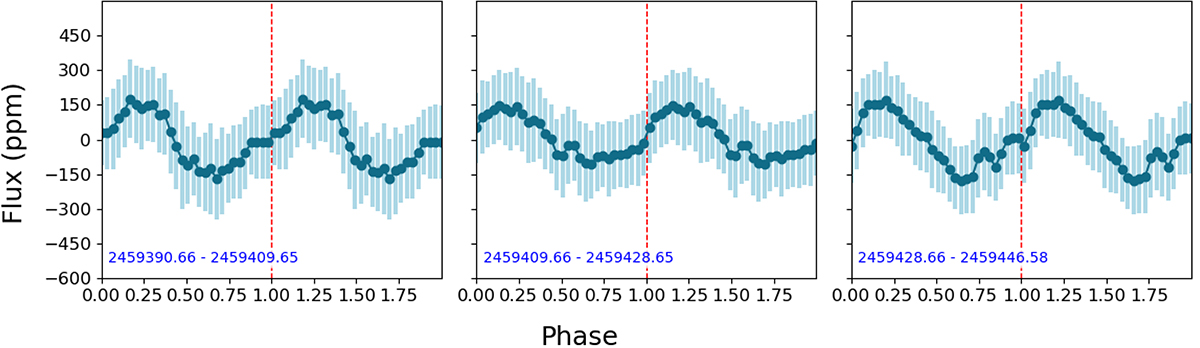
Fig. 4.
Download original image
Phase-folded original TESS data. Each panel presents 19 days combined and has been binned into 30 equal segments. The petrol-blue data points are the binned values, and the lighter blue bars represent the standard deviation.
Current usage metrics show cumulative count of Article Views (full-text article views including HTML views, PDF and ePub downloads, according to the available data) and Abstracts Views on Vision4Press platform.
Data correspond to usage on the plateform after 2015. The current usage metrics is available 48-96 hours after online publication and is updated daily on week days.
Initial download of the metrics may take a while.