Fig. 3.
Download original image
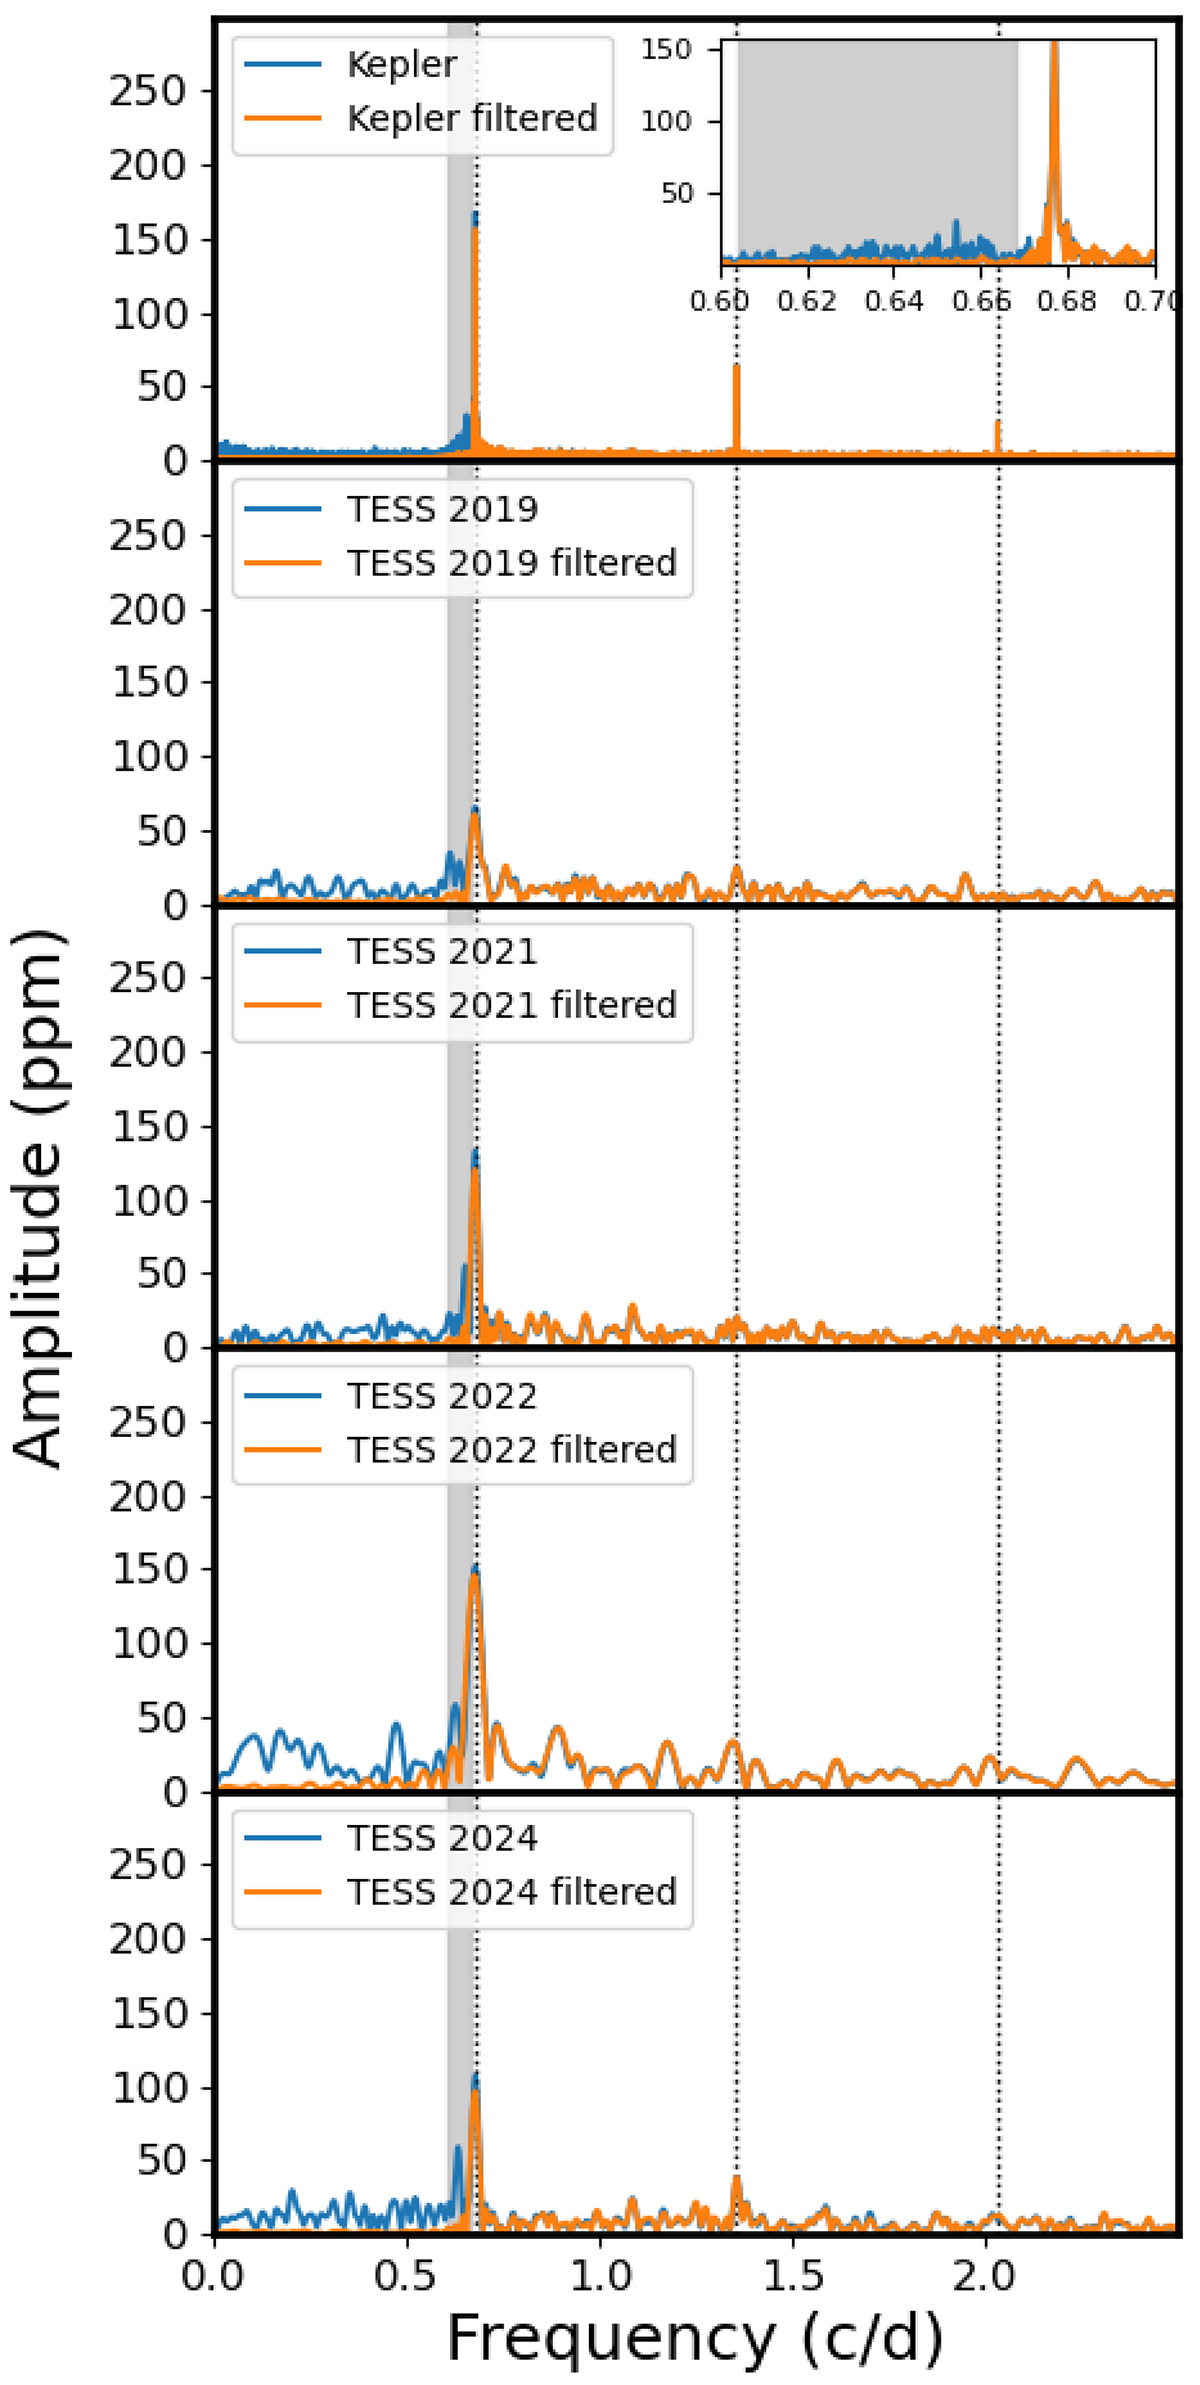
Fourier spectra of Kepler and TESS data, with Kepler shown in the upper panel and TESS data in panels 2–5. Original unfiltered data are depicted in blue, while bandpass-filtered data are shown in orange. The grey area highlights the position of the hump, and dotted black vertical lines mark the spike frequency and its harmonics. No additional signal is found beyond 2.5 cd−1.
Current usage metrics show cumulative count of Article Views (full-text article views including HTML views, PDF and ePub downloads, according to the available data) and Abstracts Views on Vision4Press platform.
Data correspond to usage on the plateform after 2015. The current usage metrics is available 48-96 hours after online publication and is updated daily on week days.
Initial download of the metrics may take a while.