Open Access
Fig. 2.
Download original image
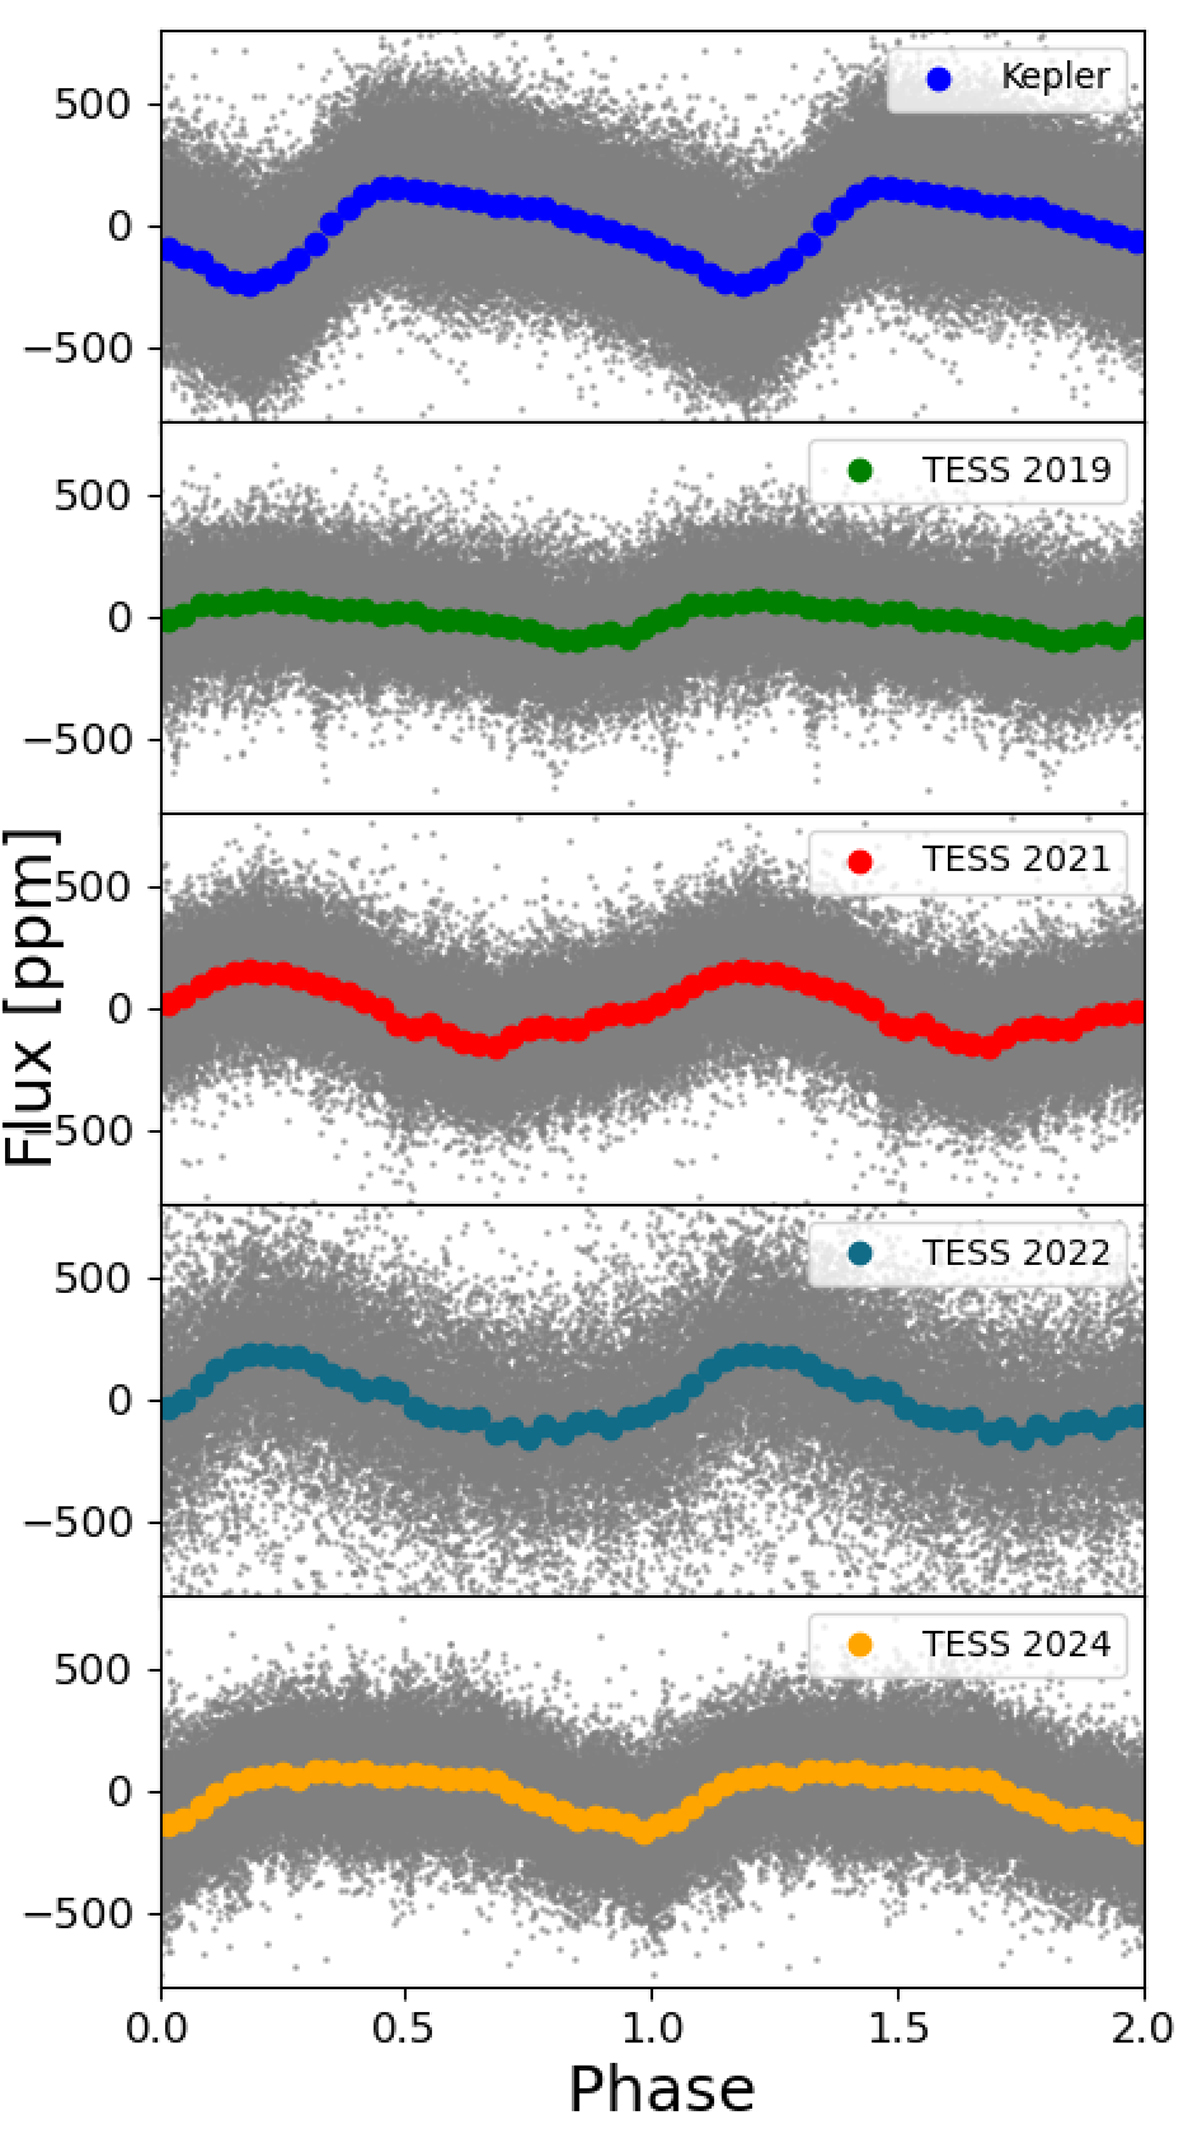
Original Kepler and TESS data (in grey) phase folded using the spike frequency derived from Kepler data. Coloured curves represent the binned data and show the median value in each of the 80 arbitrarily chosen bins.
Current usage metrics show cumulative count of Article Views (full-text article views including HTML views, PDF and ePub downloads, according to the available data) and Abstracts Views on Vision4Press platform.
Data correspond to usage on the plateform after 2015. The current usage metrics is available 48-96 hours after online publication and is updated daily on week days.
Initial download of the metrics may take a while.