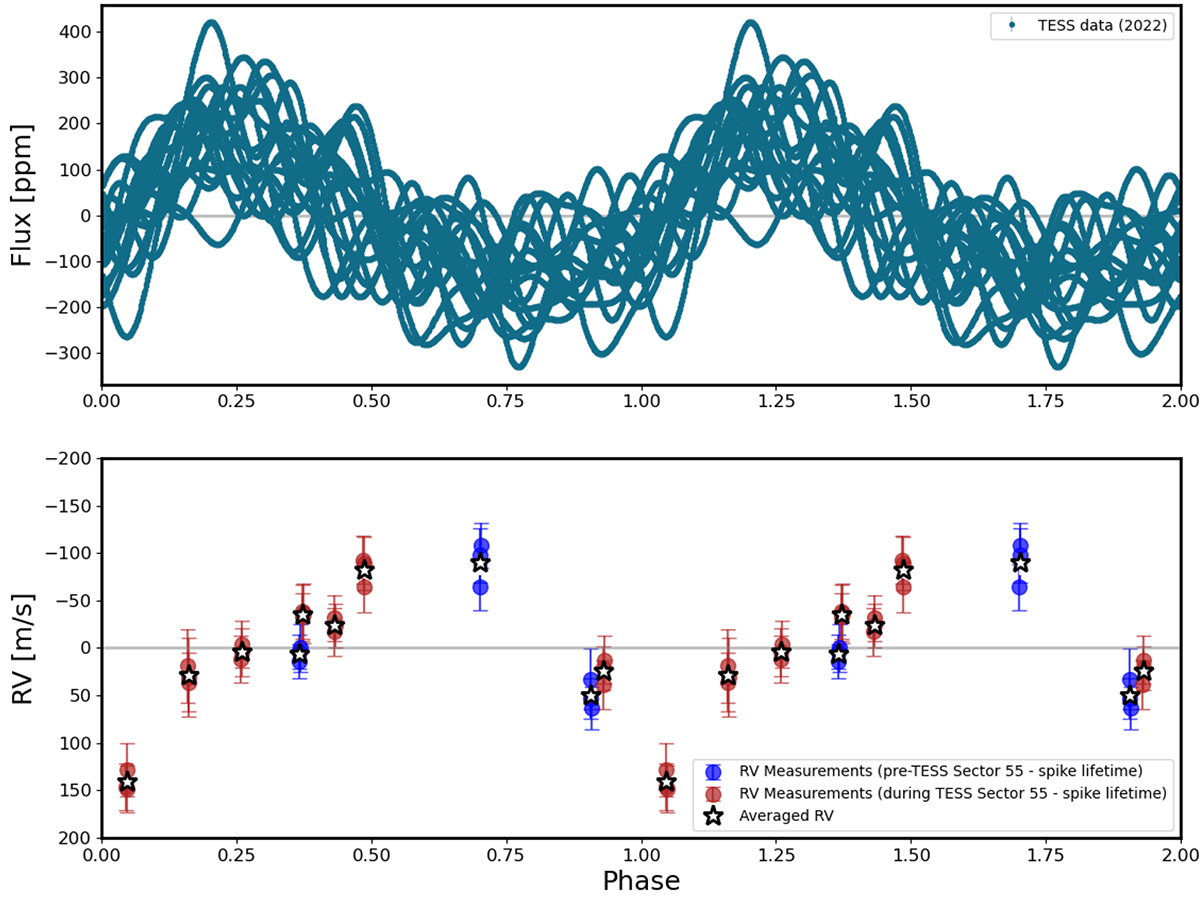
Fig. 12.
Download original image
Upper panel: Phase-folded bandpass-filtered data from TESS 2022. Lower panel: Phase-folded RV data observed simultaneously or just before TESS 2022 (Sector 55) data. The red data points represent individual observations during the TESS observing period up to 19 days prior, which reflects the spike lifetime, while the blue data points go back 30 days in time. The stars indicate the average value for each bin. We note that the RV measurements for a given epoch are from consecutive spectra (see Table A.1).
Current usage metrics show cumulative count of Article Views (full-text article views including HTML views, PDF and ePub downloads, according to the available data) and Abstracts Views on Vision4Press platform.
Data correspond to usage on the plateform after 2015. The current usage metrics is available 48-96 hours after online publication and is updated daily on week days.
Initial download of the metrics may take a while.