Fig. 11.
Download original image
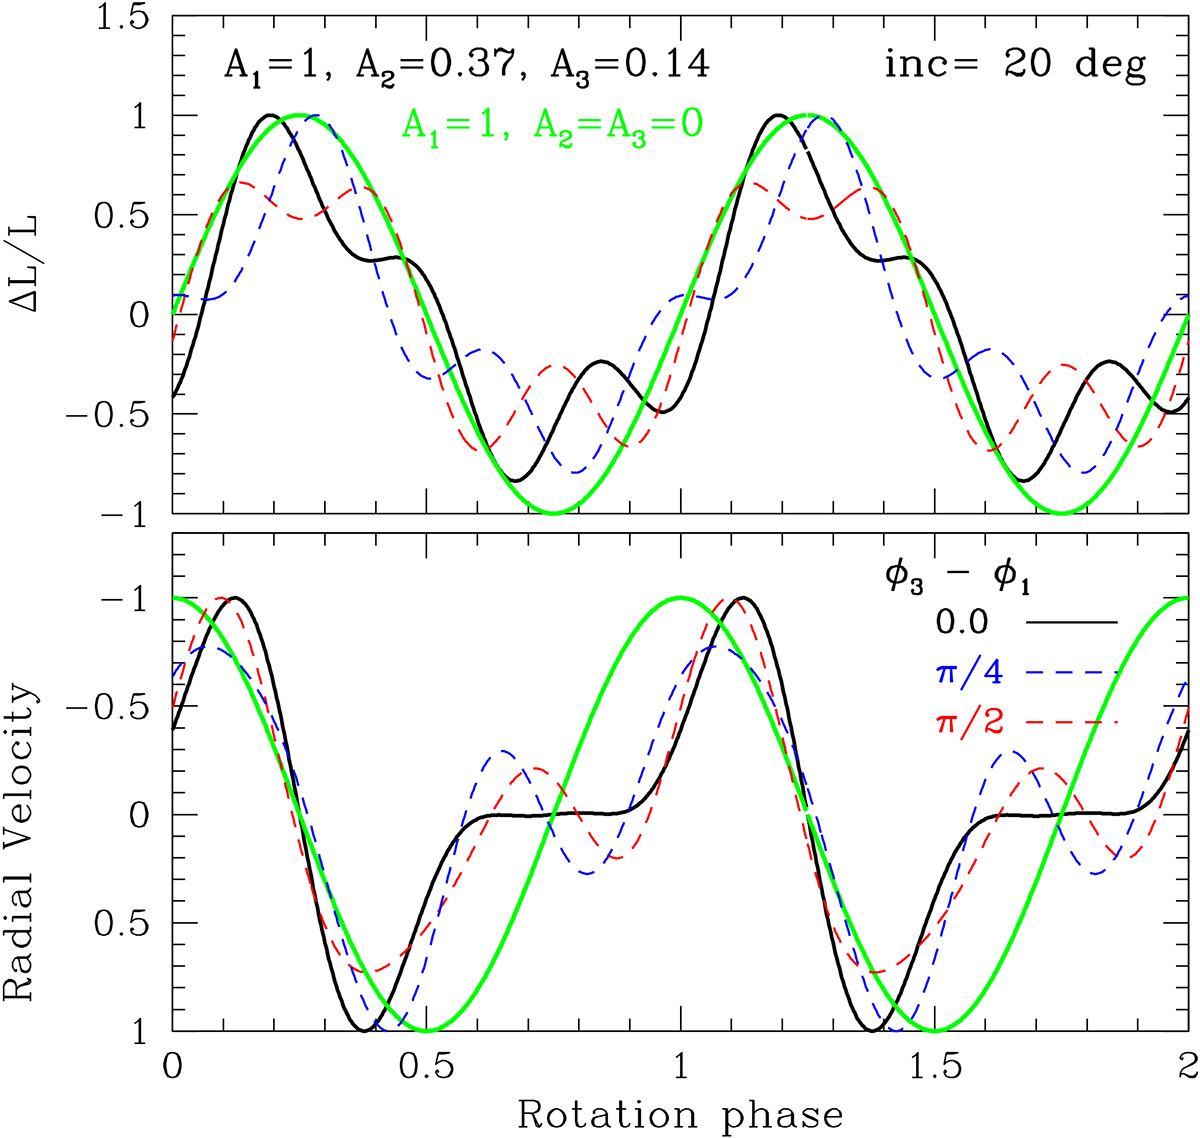
Theoretical predictions for OsC modes comparing light and RV variations, normalised so that their maxima are unity. Upper panel: Light curves predicted for the superposition of sectoral prograde g modes with m = 1, 2, 3, using amplitude ratios of 1 : 0.37 : 0.14, consistent with the amplitudes in the Kepler Fourier diagram (Fig. 3). The black solid line represents a model where the initial phases of all modes are identical. To investigate the impact of phase shifts, the m = 3 mode is adjusted as shown, while the m = 2 mode’s initial phase is aligned with that of the m = 1 mode. The green curve illustrates a scenario where only the spike (m = 1) is observable, with no contributions m = 2 and m = 3 modes. Lower panel: RV variations predicted for the same prograde g modes, using the same amplitude ratios and phase offsets as in the upper panel. The green line corresponds to a model with only the m = 1 mode. See text for more details.
Current usage metrics show cumulative count of Article Views (full-text article views including HTML views, PDF and ePub downloads, according to the available data) and Abstracts Views on Vision4Press platform.
Data correspond to usage on the plateform after 2015. The current usage metrics is available 48-96 hours after online publication and is updated daily on week days.
Initial download of the metrics may take a while.