Open Access
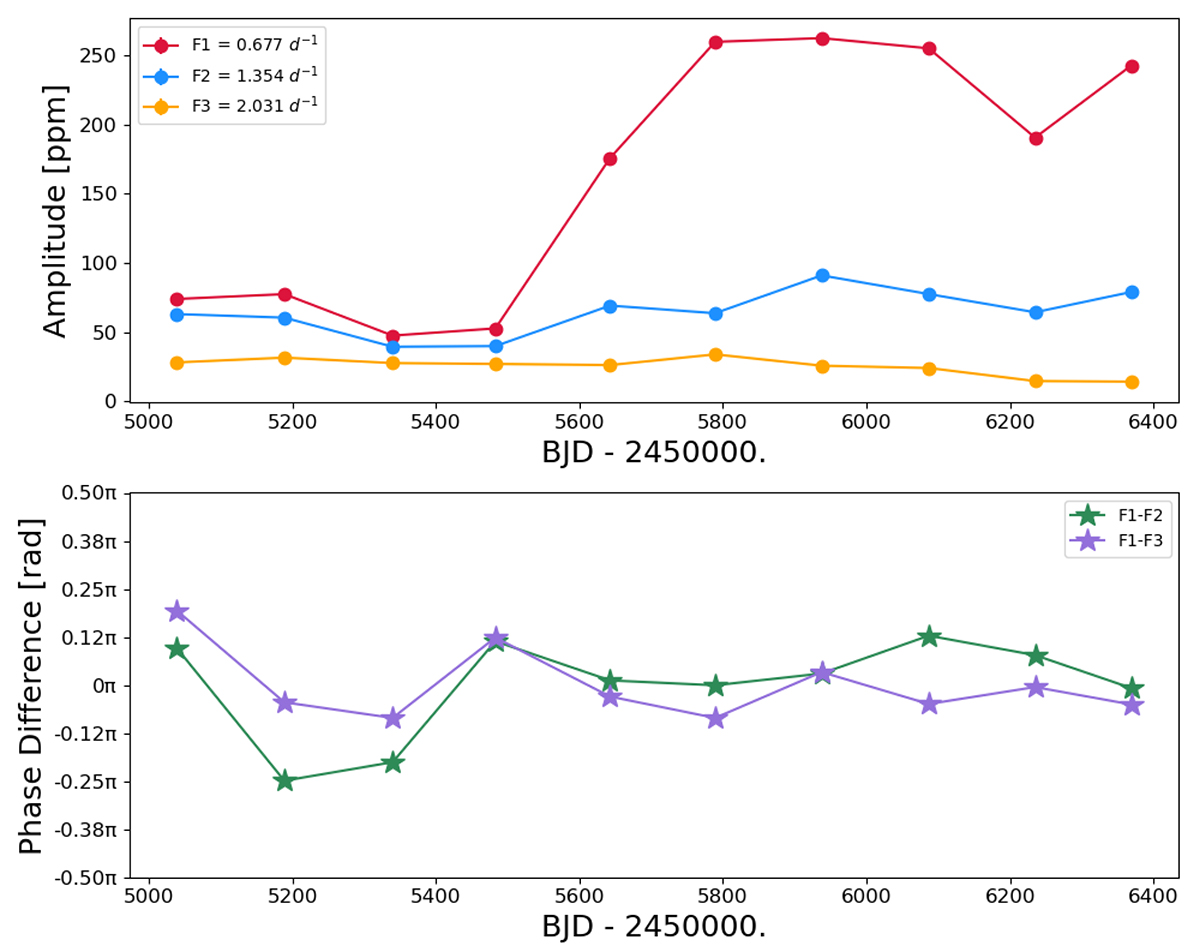
Fig. 10.
Download original image
Upper panel: Amplitudes determined for subsets of the Kepler data spanning 150 days. The BJD corresponds to the average value for each data bin. Uncertainties are smaller than the symbols depicted. Lower Panel: Phase differences. The average difference has been removed to enhance readability.
Current usage metrics show cumulative count of Article Views (full-text article views including HTML views, PDF and ePub downloads, according to the available data) and Abstracts Views on Vision4Press platform.
Data correspond to usage on the plateform after 2015. The current usage metrics is available 48-96 hours after online publication and is updated daily on week days.
Initial download of the metrics may take a while.