Fig. A.6
Download original image
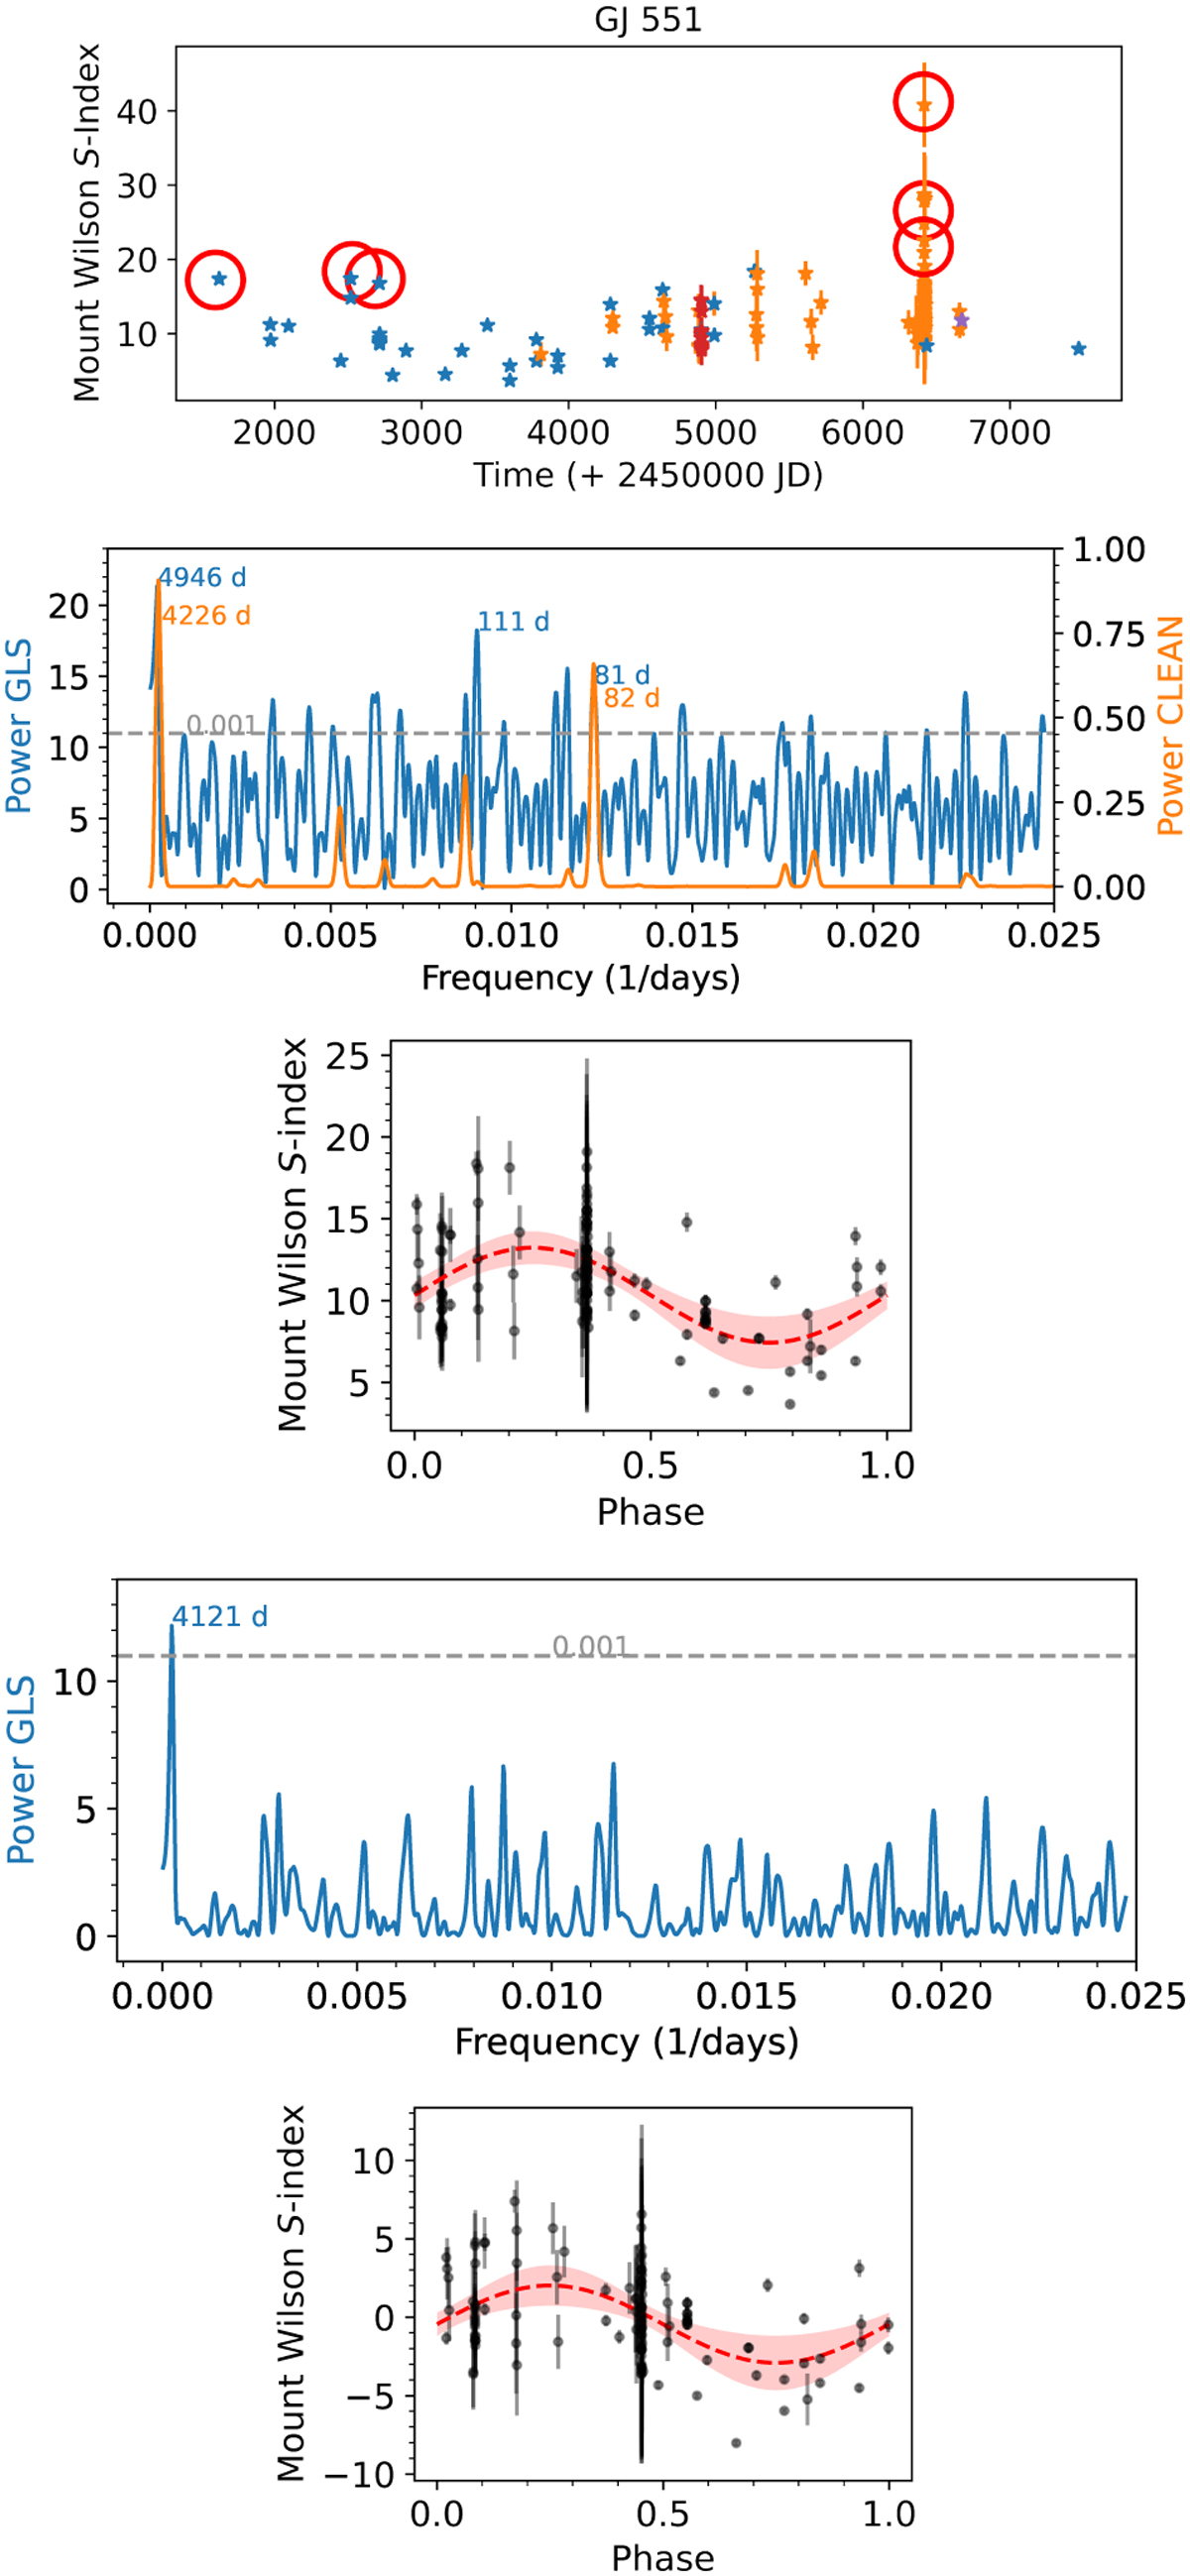
Same as Fig. A.1 but for GJ 551. GLS: PGLS;1 = (4946 ± 522) d, PGLS;2 = (110.6 ± 0.3) d, PGLS;3 = (81.5 ± 0.3) d con FAPs < 0.01%). CLEAN: PCLEAN;1 = (4226 ± 325) d and PCLEAN;2= (81.5 ± 0.2) d. Third row. Phase folded time series with a ~4900 day period. Fourth row. GLS and CLEAN periodograms after substract the signal of ~82-day peak, PGLS = 4121 ± 321 days with FAP of 0.0002. Bottom. Phase folded time series with a ~4100 day period.
Current usage metrics show cumulative count of Article Views (full-text article views including HTML views, PDF and ePub downloads, according to the available data) and Abstracts Views on Vision4Press platform.
Data correspond to usage on the plateform after 2015. The current usage metrics is available 48-96 hours after online publication and is updated daily on week days.
Initial download of the metrics may take a while.