Open Access
Fig. A.1
Download original image
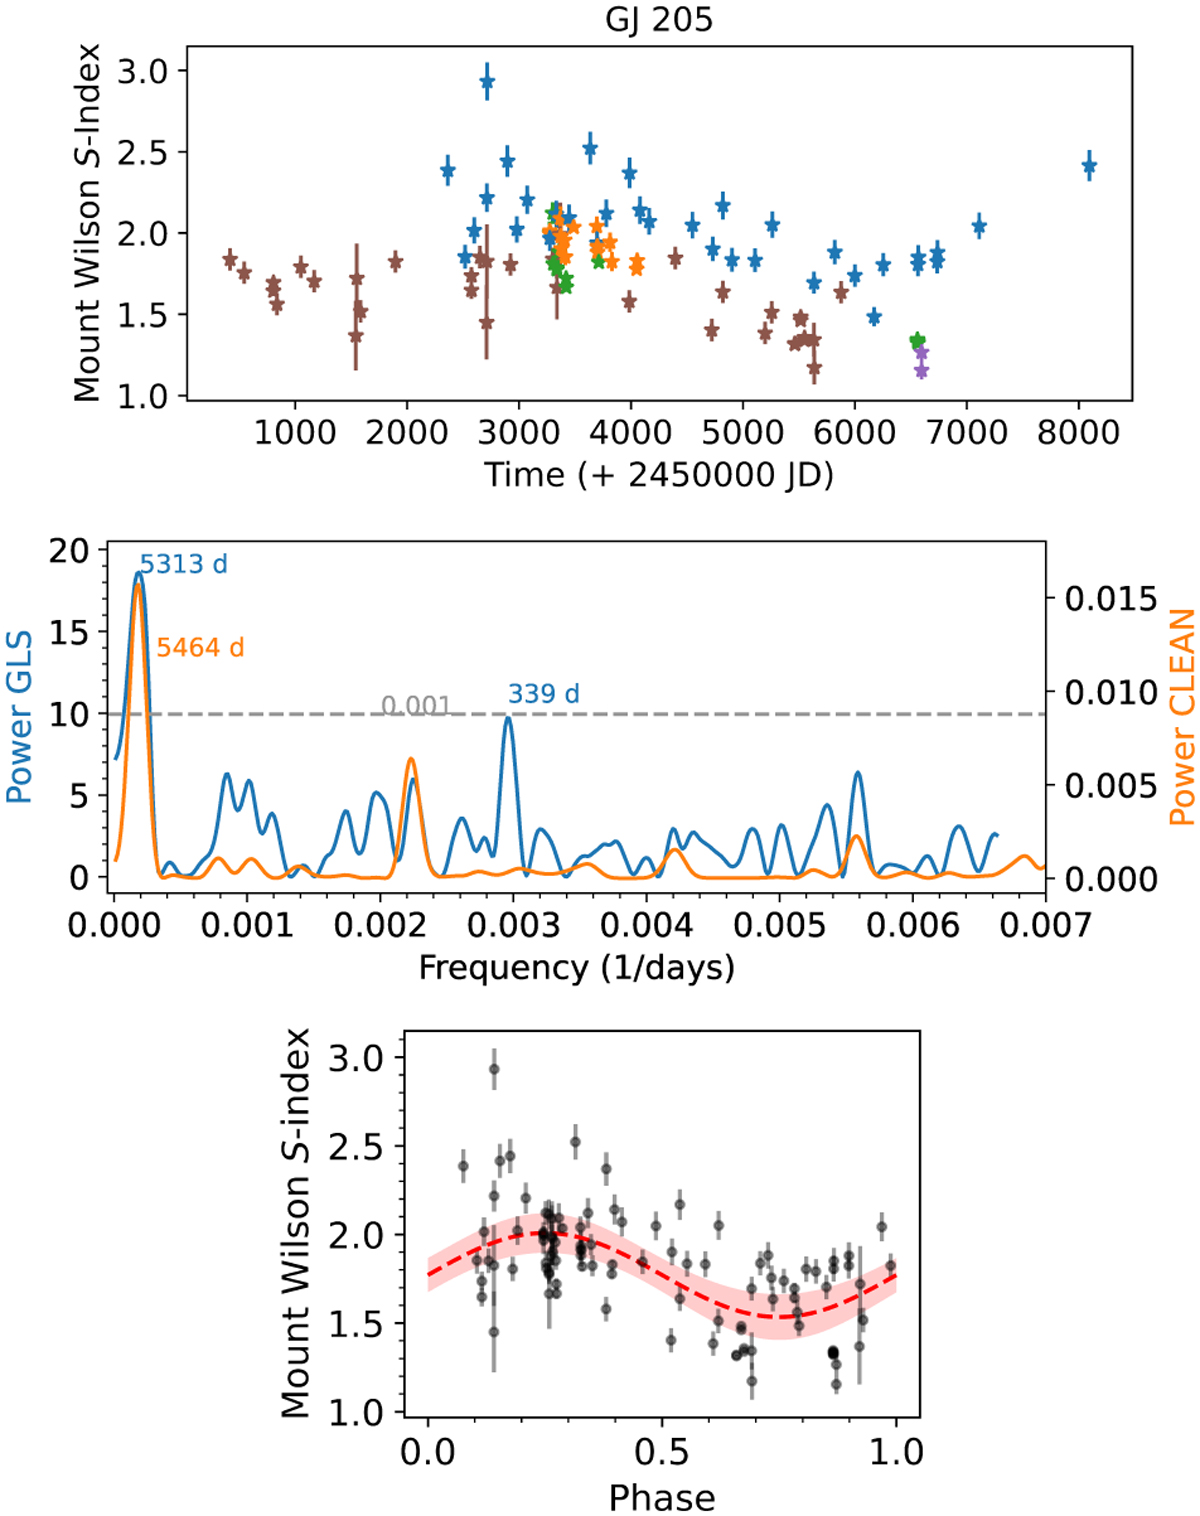
GJ 205. Top. S-Index time series. Middle. GLS and CLEAN periodograms: PGLS;1 = (5313 ± 862) d and PGLS;2 = 339 ± 3 d with a FAP < 0.01% and FAP ~ 0.001, respectively. From the CLEAN periodogram we have obtained as significant period PCLEAN = (5479 ± 196) days. Bottom. Phase folded time series with a ~5300 day period.
Current usage metrics show cumulative count of Article Views (full-text article views including HTML views, PDF and ePub downloads, according to the available data) and Abstracts Views on Vision4Press platform.
Data correspond to usage on the plateform after 2015. The current usage metrics is available 48-96 hours after online publication and is updated daily on week days.
Initial download of the metrics may take a while.