Fig. 2
Download original image
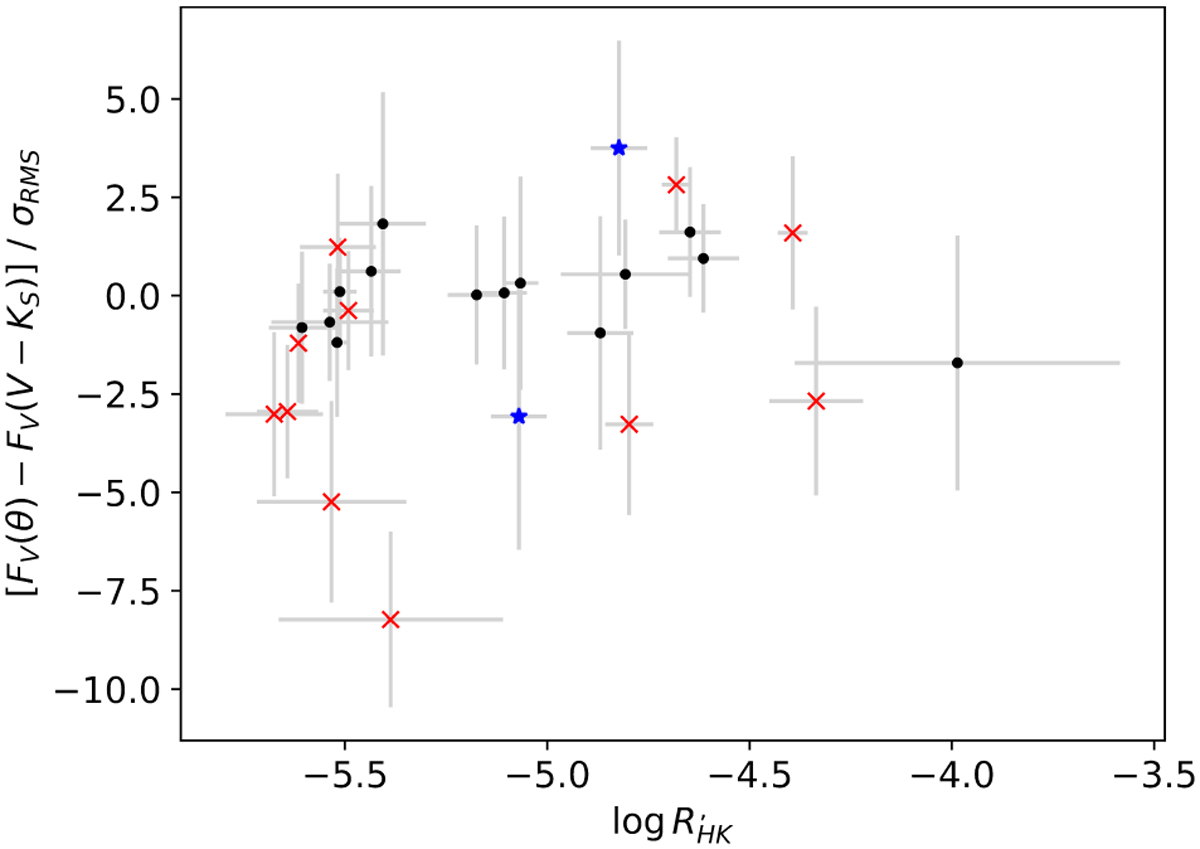
Difference between measured and computed surface brightness in units of σRMS as a function of the log ![]() index for the M dwarfs in the sample. Red crosses represent the stars rejected by Salsi et al. (2021), black dots the targets considered by Salsi et al. (2021), and blue stars the new targets added in this work. In this plot, the uncertainty on the surface brightness of each measurement has also been divided by the rms.
index for the M dwarfs in the sample. Red crosses represent the stars rejected by Salsi et al. (2021), black dots the targets considered by Salsi et al. (2021), and blue stars the new targets added in this work. In this plot, the uncertainty on the surface brightness of each measurement has also been divided by the rms.
Current usage metrics show cumulative count of Article Views (full-text article views including HTML views, PDF and ePub downloads, according to the available data) and Abstracts Views on Vision4Press platform.
Data correspond to usage on the plateform after 2015. The current usage metrics is available 48-96 hours after online publication and is updated daily on week days.
Initial download of the metrics may take a while.