Fig. 1
Download original image
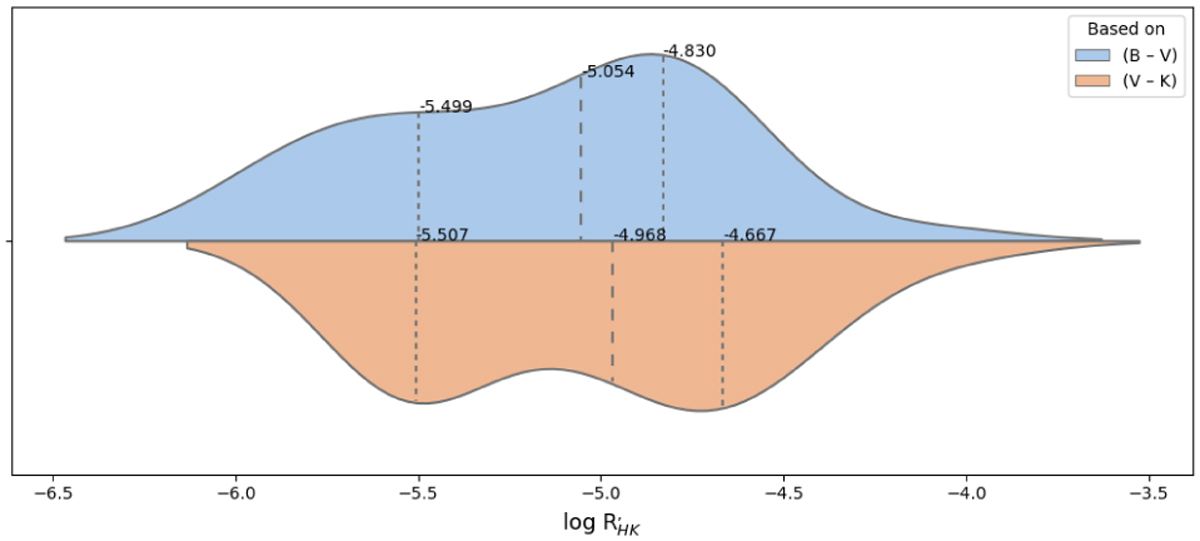
Violin diagram of chromospheric-activity-level distribution for the stars in the sample. The vertical lines with their respective numbers indicate the values of the first, second, and third quartiles. Most of the stars in the sample show low levels of chromospheric emission indicating that most of them are inactive or very inactive.
Current usage metrics show cumulative count of Article Views (full-text article views including HTML views, PDF and ePub downloads, according to the available data) and Abstracts Views on Vision4Press platform.
Data correspond to usage on the plateform after 2015. The current usage metrics is available 48-96 hours after online publication and is updated daily on week days.
Initial download of the metrics may take a while.