Fig. 9
Download original image
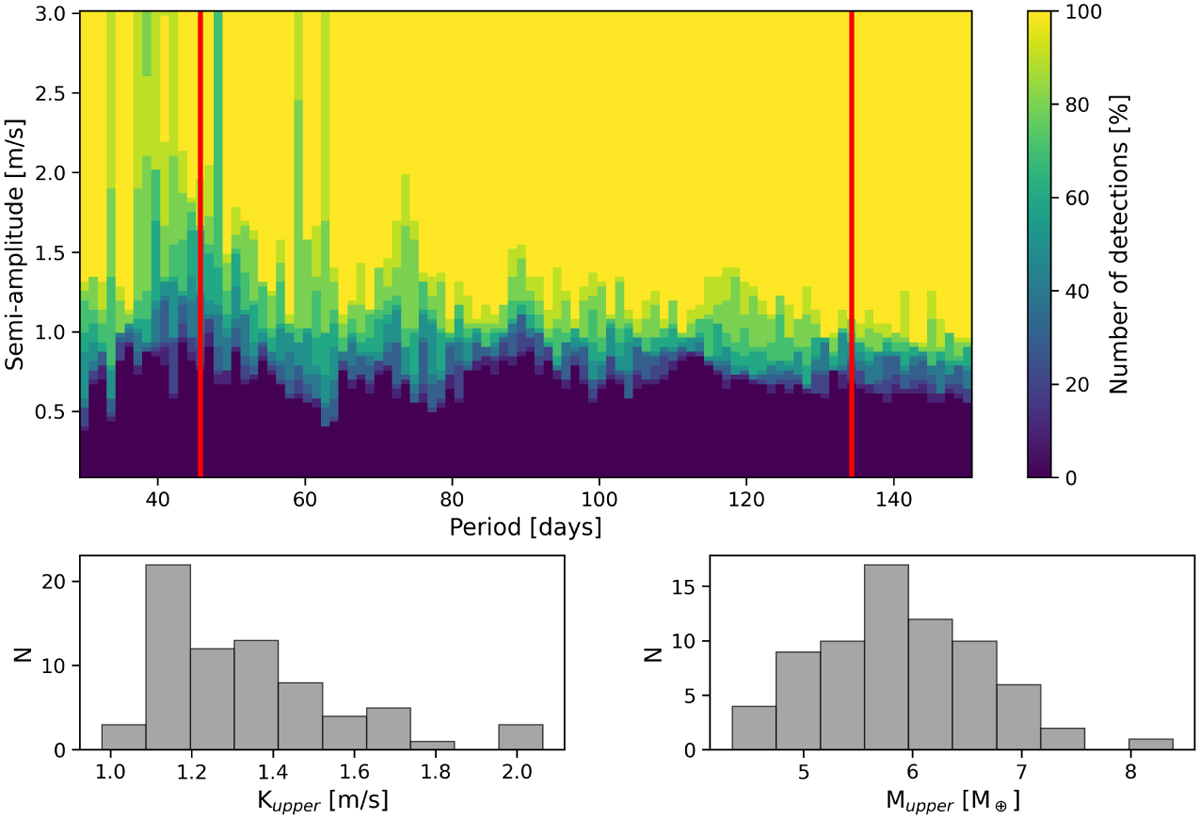
Results of the injection-recovery test assessing the detectability of a planetary signal in the dataset. The top panel shows the detection rate as a function of orbital period and semi-amplitude; the colors represent the percentage of successful detections. The red vertical lines indicate the boundaries of the habitable zone. The bottom panels display histograms of Kupper (left) and Mupper (right), representing the semi-amplitude threshold at which the detection rate reaches 100% and its corresponding minimum planetary mass.
Current usage metrics show cumulative count of Article Views (full-text article views including HTML views, PDF and ePub downloads, according to the available data) and Abstracts Views on Vision4Press platform.
Data correspond to usage on the plateform after 2015. The current usage metrics is available 48-96 hours after online publication and is updated daily on week days.
Initial download of the metrics may take a while.