Fig. 10
Download original image
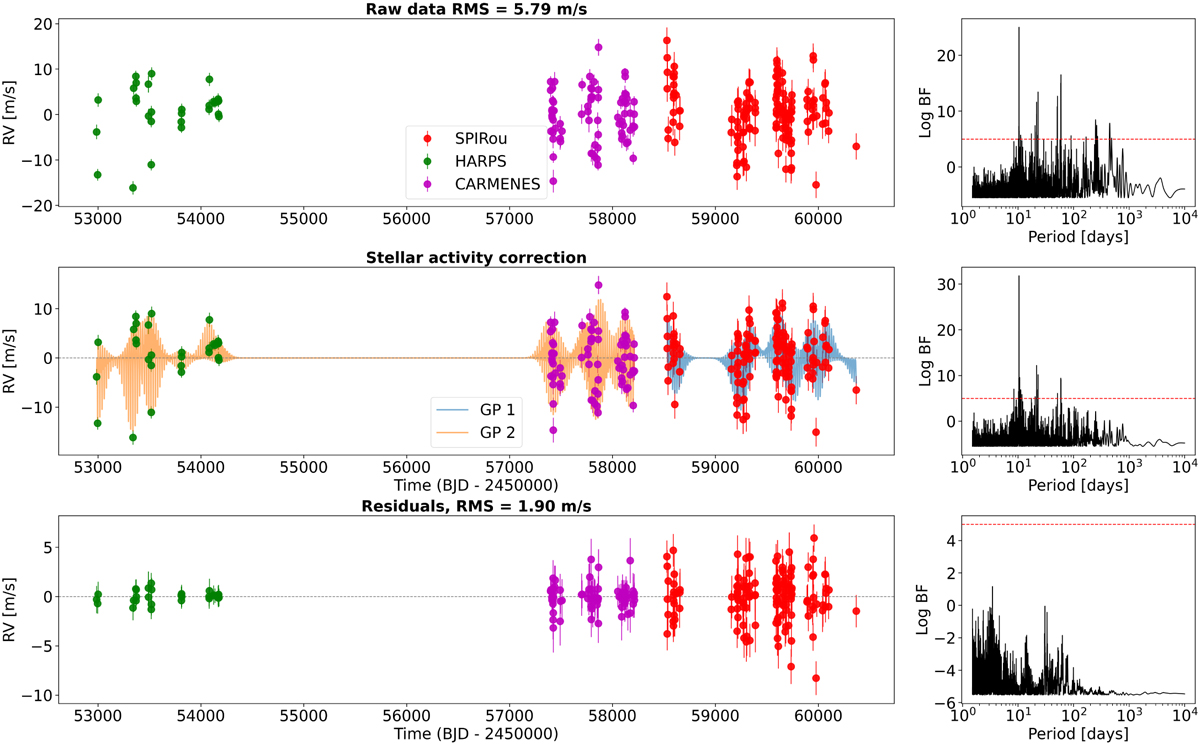
Final RV model for Gl 382. The top panel shows the raw RV data with offsets removed, plotted for the SPIRou, HARPS, and CARMENES instruments (RMS = 5.79 m.s−1). The second row illustrates the correction for stellar activity using GPs, with individual GP contributions shown for each grouped instrument. The bottom panel presents the residuals after removing all modeled signals (RMS = 1.90 m.s−1). The rightmost column contains log BF periodograms highlighting significant periods in the RV data, the significance level of 5 is indicated by the horizontal red dashed line.
Current usage metrics show cumulative count of Article Views (full-text article views including HTML views, PDF and ePub downloads, according to the available data) and Abstracts Views on Vision4Press platform.
Data correspond to usage on the plateform after 2015. The current usage metrics is available 48-96 hours after online publication and is updated daily on week days.
Initial download of the metrics may take a while.