Fig. 18.
Download original image
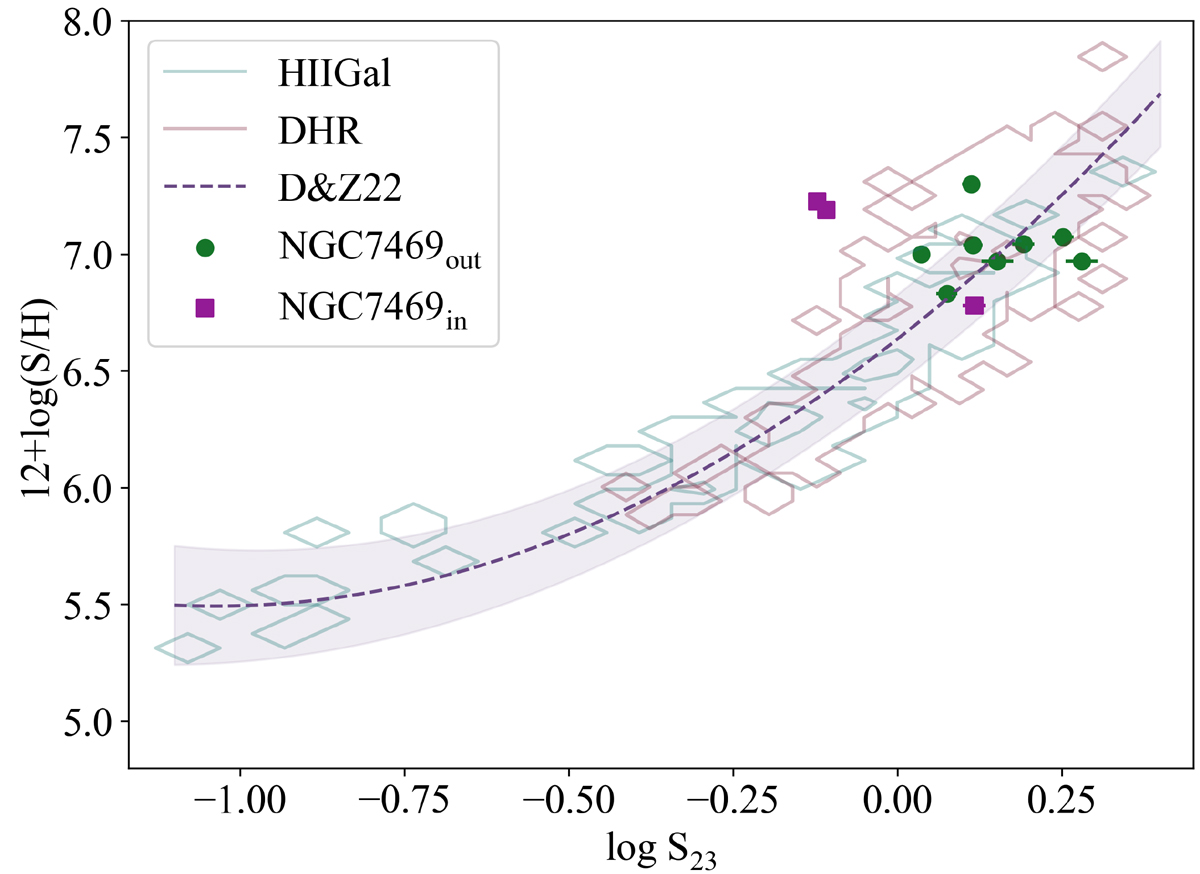
The S23 abundance calibration from Díaz & Zamora (2022). The red contours correspond to disc HII regions, while the blue contours correspond to HII galaxies. The green dots and purple squares represent respectively the outer and inner ring regions analysed in this work. Observational errors for these data are inside the symbols in the graph.
Current usage metrics show cumulative count of Article Views (full-text article views including HTML views, PDF and ePub downloads, according to the available data) and Abstracts Views on Vision4Press platform.
Data correspond to usage on the plateform after 2015. The current usage metrics is available 48-96 hours after online publication and is updated daily on week days.
Initial download of the metrics may take a while.