


| Issue |
A&A
Volume 711, July 2026
|
|
|---|---|---|
| Article Number | A233 | |
| Number of page(s) | 17 | |
| Section | Extragalactic astronomy | |
| DOI | https://doi.org/10.1051/0004-6361/202659401 | |
| Published online | 17 July 2026 | |
Physical properties of circumnuclear ionising clusters
IV. NGC 1097
1
Scuola Normale Superiore, Piazza dei Cavalieri 7, I-56126 Pisa, Italy
2
Departamento de Física Teórica, Universidad Autónoma de Madrid, 28049 Madrid, Spain
3
CIAFF, Universidad Autónoma de Madrid, 28049 Madrid, Spain
4
Observatorio Astronómico Nacional (IGN), C/Alfonso XII, 3, 28014 Madrid, Spain
★ Corresponding author: This email address is being protected from spambots. You need JavaScript enabled to view it.
Received:
10
February
2026
Accepted:
27
April
2026
Abstract
The circumnuclear star-forming ring of the barred spiral galaxy NGC 1097 provides a unique laboratory to study star formation under extreme conditions. In this work, we aim to derive the physical properties of the circumnuclear star-forming regions (CNSFRs) using MUSE integral field spectroscopy observations. We identified and analysed a total of 24 individual ionised HII within its ring, which spans from ∼385 pc to ∼1.3 kpc. Despite the complex nuclear activity, all HII regions were found to be purely photoionised. Directly derived abundances reveal supersolar metallicities, with the highest one exceeding five times the solar value (12+log(S/H) = 7.875 ± 0.353, Te([SIII]) = 3912 ± 567 K) and representing the highest abundance reported to date. In this high-metallicity regime, we found a break in the ionisation parameter–[SII]/[SIII] relation, which can be explained by changes in the ionisation structure and line emissivities, as confirmed by photoionisation models that successfully reproduce the observed emission-line ratios. Our results also indicate that the local gas supply regulates the star formation activity within the ring, with the young stars ionising 8% of the total gas in the ring. Furthermore, our findings support a propagating starburst scenario originating in the galaxy nucleus and extending towards the ends of the bar and into the circumnuclear ring through bar-driven shocks, which is consistent with the results of previous multi-wavelength studies. Finally, we likely detected optical signatures associated with one of the two known jets in this galaxy. This finding, together with the radio core emission previously found at sub-parsec scales, reflects the presence of feedback processes operating even on small galactic disc scales.
Key words: ISM: abundances / HII regions / galaxies: ISM / galaxies: starburst / galaxies: star clusters: general / galaxies: star formation
© The Authors 2026
 Open Access article, published by EDP Sciences, under the terms of the Creative Commons Attribution License (https://creativecommons.org/licenses/by/4.0), which permits unrestricted use, distribution, and reproduction in any medium, provided the original work is properly cited.
This article is published in open access under the Subscribe to Open model. This email address is being protected from spambots. You need JavaScript enabled to view it. to support open access publication.
1. Introduction
Galactic nuclei are often thought to be the sites of energetic and violent phenomena related to the presence of central massive black holes, which are intimately connected with the structure, origin, and evolution of galaxies. The study of the physical conditions of the gas in the circumnuclear regions of galaxies can greatly help our understanding of the existing connections between nuclear activity and star formation processes (Nakajima et al. 2023; Díaz et al. 2007; Dors et al. 2008). This gas represents probably the most evolved gaseous system in which we can measure the chemical abundances in a direct manner; these abundances can provide important information about the chemical evolution of galactic nuclei and also serve as tests of theories of nucleosynthesis and stellar evolution (i.e. Martini et al. 2003; Papadopoulos & Allen 2000; Lai et al. 2022). On the other hand, the metal content of the gas can affect star-formation, stellar structure and evolution, and dust particles, and these in turn can modify the central regions of galaxies.
This is the fourth article of a series in which the peculiar conditions of star formation in circumnuclear regions are studied using the full spectral region observed, from 4800 to 9300 Å, provided by archival data obtained with the Multi Unit Spectroscopic Explorer (MUSE) spectrograph attached to one of the ESO Very Large Telescope (VLT). As already explained in the first paper of this series (Zamora & Díaz 2023), the usually high abundances of the gas in circumnuclear star-forming regions (CNSFR) and their low excitation produce very weak nebular [OIII] lines that are difficult to measure with confidence, thus making practically impossible the use of these lines customary employed for abundance analysis. However, the extended wavelength range to the red covered by MUSE allows for the use of auroral and nebular forbidden emission lines of sulphur, which has proven to be an excellent abundance tracer for the characterisation of HII regions and ionising clusters at high metallicities (Díaz & Zamora 2022).
NGC 1097 (also known as Arp 77 and Caldwell 67) is a southern hemisphere barred spiral galaxy which displays several remarkable peculiarities. It was discovered back in the late 18th century by William Herschel using his 18.7 inch reflector in England since, at a latitude of −30 degrees, the source was very bright and visible a few degrees above the horizon. Its nuclear region was shown by Burbidge & Burbidge (1960) and Sérsic & Pastoriza (1965) to consist of a bright core surrounded by an almost complete ring of about 1.5 kpc diameter where most of the galaxy’s star formation is currently taking place, as evidenced by the presence of a good number of HII regions. This star formation is thought to be caused by inflows of gas along the galaxy bar. The ring was studied spectroscopically during the last century using a variety of instrumentation in different wavelength ranges (see e.g. Meaburn et al. 1981; Talent 1982; Osmer et al. 1974 in the optical; Telesco & Gatley (1981) in the infrared; and Wolstencroft et al. (1984) at radio frequencies).
More recently, Beirão et al. (2010) have studied the physical properties of the interstellar medium (ISM) in the ring using spatially resolved far-infrared (IR) observations made with the PACS spectrometer on board the Herschel Space Observatory. They presented maps of the IR emission lines of oxygen, nitrogen, and carbon ([OI] 63 μm, [OIII] 88 μm, [NII] 122 μm, [CII] 158 μm and [NII] 205 μm) along the ring, showing rapid rotation (∼220 km/s).
The galaxy shows evidence of interaction with one close satellite, NGC 1097A, distorting its disc and it has another satellite, NGC 1097B, that was discovered by its HI emission, which seems to be a dwarf irregular. NGC 1097 also shows faint optical jet-like features directed radially from the nucleus and extending out to projected distances as large as 90 kpc, which were discovered by Wolstencroft & Zealey (1975). According to Carter et al. (1984) the colours of the jets are consistent with being composed of late-type stars and supposed to be stellar streams resulting from past minor mergers, although some authors suggest that a relationship between the mild activity of the galaxy nucleus and the optical jets might exist (Storchi-Bergmann et al. 1993). Additionally, there is a radio core emission and the possible presence of a jet at sub-parsec scale (Mezcua & Prieto 2014; Orienti & Prieto 2010), although Prieto et al. (2005, 2019) do not see evidence for collimated large-scale radio emission.
In this work, we analyse the circumnuclear environment of NGC 1097 using publicly available MUSE IFS observations (Bacon et al. 2010), whose characteristics are listed in Table 1. These observations reveal the prominent circumnuclear star-forming ring, with a diameter ∼1.5 kpc, showing intense star formation. As mentioned above, high-resolution optical, infrared, and radio observations reveal the ring as a bright assembly of massive young star clusters, each with masses of ∼105 M⊙ at all the ages. Using IR to optical high-angular resolution observations down to parsec scales, (Prieto et al. 2019) resolved more than 300 young stellar clusters in the ring. The stellar population analysis at cluster level revealed four star cluster generations, occurring at 4 Myr, ∼30 Myr, ∼50–60 Myr and ∼90 Myr.
NGC 1097 global properties.
Streamers of gas have been observed flowing further inwards towards the central black hole (BH). They have been observed in HI and dust, and they are channeling matter from the outskirts of the galaxy straight to the central parsec to feed the circumnuclear ring and the BH (Prieto et al. 2005, 2019; Ondrechen et al. 1989).
Due to its proximity, brightness, barred structure, active nucleus, and bright circumnuclear star-forming ring, NGC 1097 constitutes an excellent case of study to understand how bar-driven inflows can build and sustain nuclear rings as well as their role as starburst reservoirs and as channels feeding the galactic centre in the so called starburst–AGN connection.
In Section 2, we describe the observations; our analysis and the results concerning the ionised gas are presented in Section 3, including the emission line and continuum maps of the circumnuclear ring and the selection, emission line measurements, and chemical abundances of the HII regions associated with it. In Section 4, we discuss the results in the context of circumnuclear regions in other galaxies and using a multi-wavelength approach. Finally, Section 5 provides a summary of this work and presents our conclusions.
2. Observations
NGC 1097 was observed on 2017 June 14 as a part of the ESO Programme 097.B-0640(A). The observations consisted of eight exposures summing up to a total exposure time of 3840 s, with 1 arcsec offsets in declination and different rotation angles between exposures. Sky frames were acquired following the target observations to allow for proper sky subtraction. The median seeing was 0.525 arcsec. Data reduction was carried out by the ESO Quality Control Group using an automated process with MUSE pipeline version 1.6.4 (Weilbacher et al. 2014), following the procedures explained in Zamora & Díaz (2023).
3. Data analysis and ionised gas results
We analysed the data following the methodology described in Zamora & Díaz (2023) (see also Zamora & Díaz 2025). However, due to the particular complexity of this galaxy, our study focuses exclusively on the ionised gas and does not address the stellar cluster population properties. The main steps of the analysis are: (i) performing 2D maps for different emission lines and continuum bands; (ii) selecting HII regions from the Hα emission line map; (iii) extracting each region spectrum and measuring the available emission lines; (iv) deriving chemical abundances for each of the CNSFRs. In what follows, only specific details introduced for this galaxy are explained.
3.1. Emission line and continuum maps
From the data cube, we constructed two-dimensional maps for various emission lines and two continuum bands. The top-left panel of Fig. 1 shows the spatial distribution of the observed Hα flux, revealing ionised HII regions surrounded by diffuse gas remaining into the ring, which forms arcs and stream-like structures. The nucleus and the inner ring of the galaxy are clearly distinguished, and several smaller ionised regions are also visible, located within the ring near the central part of the galaxy.
 |
Fig. 1. From left to right and top to bottom: Maps of the observed Hα and [OIII]λ5007 Å emission line fluxes (in units of 10−20 erg/s/cm2 and logarithmic scale); AV extinction (in magnitudes); observed continuum fluxes in the blue and red parts of the spectrum (5400 Å and 8150 Å respectively), in units of 10−17 erg/s/cm2 and logarithmic scale); and EW(Hα) in Å. Orientation: North is up and east is to the left. |
The top-central panel of the same figure presents the [OIII]λ5007 Å emission map. This emission is dominated by the nucleus, and the ionised regions, with the ring having a less diffuse morphology compared to the Hα emission. Additionally, an arc in the lower right part of the ring is clearly visible, which corresponds with the location of one of the jets observed in this galaxy (Wolstencroft & Zealey 1975; Arp 1976; Lorre 1978; Phillips et al. 1984).
The top-right panel shows the extinction map derived from the combination of the Hα and Hβ maps, using the Galactic extinction law of Miller & Mathews (1972), a specific attenuation of RV = 2.97, and the theoretical Hα/Hβ ratio of 2.87 from Osterbrock & Ferland (2006) (ne = 100 cm−3, Te = 104 K, case B recombination). In this map, the inner ring is clearly visible, showing lower extinction in its upper part (∼1.5 mag) compared to its lower one (∼3 mag), likely due to the inclination of the ring.
The two bottom-left panels show the maps of the observed continuum flux at blue (5400 Å) and red (8150 Å) wavelengths. In both maps, the continuum emission originates from the centre of the galaxy, and a two armed structure is clearly identified, along with a bar that becomes more prominent in the redder continuum likely because it is formed by an old stellar population. The dominant continuum emission comes from the young star ionising clusters, which show more emission at blue wavelengths.
Finally, the bottom-right panel of Fig. 1 shows the map of the Hα equivalent width (EW) in Å. Notably, two distinct streams are evident: one coinciding with the position of the [OIII] arc and another on the opposite side. Its origin is likely associated with an interaction between the interstellar medium (ISM) and the jets, which are located exactly in these directions, and can compress or shock the surrounding gas, enhancing its ionisation and producing the observed emission features. All circumnuclear regions show EW(Hα) values greater than 100 Å, consistent with the presence of massive stars (initial mass larger than 20 M⊙, Mollá et al. 2009) formed in a recent star-formation episode within the last 10 Myr.
3.2. HII region selection
The HII region selection method is described in detail in Zamora & Díaz (2023). First, we identified the projected size of the ring from the Hα pixel by pixel radial profile, which extends from 4.8 to 16.4 arcsec (∼385 pc–1.3 Kpc assuming a distance of 16.6 Mpc, Mould et al. 2000).
Then, we used an iterative procedure applied to the Hα emission line maps, which detects high intensity clumps and then adds adjacent pixels according to several input parameters: the level of diffuse gas emission, the relative flux intensity of each region with respect to its central peak, and the maximum and minimum extents of the regions, determined according to their typical projected sizes and the point spread function of the observations respectively.
Finally, we imposed two quality control requirements to the integrated spectra extracted from each selected region to ensure their physical meaning and the star formation origin of the emission: (i) EW(Hα) > 6 Å (Sánchez et al. 2015), and (ii) 2.7 < Hα/Hβ < 6.0 (Osterbrock & Ferland 2006, ne = 100 cm−3, Te = 104 K).
At the end of the procedure, we identified a total of 24 HII regions in the ring. We repeated the procedure in the inner circumnuclear region outside the ring and we identified 5 additional regions. Figure 2 shows the HII regions selected and Table A.1 summarises their properties, including the position of each region relative to the galaxy centre, its size, and the observed integrated Hα flux.
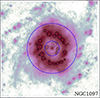 |
Fig. 2. HII regions selected using our segregation program on the Hα observed emission line map. The aperture used to define the ring for the segregation of the regions is overplotted in blue. A logarithmic colour scale is used. Orientation: North is up, east is to the left. The physical scale is represented at the bottom left corner of the map. |
We identified our HII regions with those selected by Kotilainen et al. (2000, K00) using the Brγ emission in the infrared. Their observations were performed with UKIRT–IRCAM3 photometry in the JHK bands, with a seeing of FWHM = 0.6–0.7 arcsec and a pixel scale of 0.281 arcsec/pix. Ten of our selected regions show corresponding IR emission, with one of them being a double identification in their study. We repeated the identification for the emission regions reported by Hummel et al. (1987, H97), who used radio continuum emission at 1.465 GHz from Very Large Array observations with a spatial resolution of 2.5 arcsec. Seven of our HII regions have emission in radio continuum. The correspondence between our identified regions and those reported by the authors is presented in Table A.6.
3.3. Emission line measurements and uncertainties
We extracted the spectrum of each region by integrating the flux within its corresponding aperture and we measured the intensity of their emission lines following the procedure described in Zamora & Díaz (2023). We requested a S/N ratio larger than 3 for the strong emission lines: Hβ and Hα Balmer lines; [OIII]λλ 4959,5007 Å, [NII]λλ 6548,84 Å, [SII]λλ 6716,31 Å, and [SIII]λ 9069 Å forbidden lines. We did not detect the [SIII]λ 9069 Å forbidden line in the inner regions outside the ring. In addition, we measured the weak [SIII]λ 6312 Å auroral line with S/N > 1 in 11 ring regions, all of them with measurements of [SIII]λ 9069 Å.
We corrected the measured line intensities for dust extinction using the coefficient c(Hβ), derived from the observed Hα and Hβ Balmer ratio. A simple screen dust distribution was assumed, with identical extinction applied to both the emission lines and the stellar continuum. We adopted the Galactic extinction law of Miller & Mathews (1972), with a specific attenuation of RV = 2.97. A theoretical Hα/Hβ ratio of 2.87 was used (ne = 100 cm−3 and Te = 104 K, Osterbrock & Ferland 2006).
A typical HII region spectrum is shown in Fig. 3, illustrating that in high metallicity environments such as the central regions of galaxies, the [OIII]λλ 4959,5007 Å emission lines, commonly used to measure chemical abundances, are almost undetectable, while the nebular [SIII]λ 9069 Å line is clearly detected. Table A.2 presents the reddening-corrected emission line intensities of the strong lines relative to Hβ, together with the corresponding reddening constant for all the ring regions analysed.
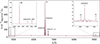 |
Fig. 3. Extracted spectrum of region R2. |
3.4. Chemical abundances
We measured the CNSFR metallicities using their sulphur abundances following the methodology described in Díaz & Zamora (2022), which is particularly well suited for the MUSE wavelength range, using the sulphur lines as a tracer of abundances. Its main advantages are: (i) reddening effects are reduced due to the longer wavelengths involved, (ii) sulphur does not appear to be depleted in diffuse clouds (Rodríguez-Baras et al. 2021), and (iii) the [SIII]λ6312 Å auroral line can be detected and measured up to at least solar abundances (Díaz et al. 2007), as those expected in the central regions of galaxies.
We measured this line with a S/N ratio higher than 1 in approximately 46% of the HII regions, consistent with the detection fractions reported in previous studies (35–45%, Zamora & Díaz 2023, 2025). For these regions, total sulphur abundances have been derived using the direct method described in Zamora & Díaz (2023). In this approach, the [SIII] electron temperature, Te([SIII]), is calculated from the ratio of the nebular to auroral lines of this ion. We obtained a median value of Te([SIII]) ∼ 0.5486 × 10⁴ K.
The equation used to determine this temperature exhibits only a very weak dependence on the electron density. Nevertheless, we employed PyNeb (Luridiana et al. 2015) to compute the electron densities of the CNSFRs from the [SII]λλ 6717,6731 Å doublet ratio. The derived electron densities within the ring are low and confined to a narrow range centred around ne ∼ 240 cm−3, with a median value of 236 cm−3 and a standard deviation of 67 cm−3, corresponding to the lower limit of densities measurable with these lines. Therefore, the weak dependence of the temperature calculation on the density is not relevant in our case, since Te([SIII]) increases by only 3% for ne values between 100 and 1000 cm−3 (Pérez-Montero 2017).
Assuming a single-zone approximation where Te(S+) ∼ Te(S++) = Te([SIII]), representing the characteristic electron temperature of the whole nebula, we derived the total sulphur abundances for these CNSFRs. We obtained a median close to the solar value 12+log(S/H) = 7.11. The highest measured abundance reaches (12+log(S/H) = 7.88 ± 0.35), corresponding to more than five times the solar value. The two ionic species present, S+ and S++, contribute approximately 60% each to the total abundance (the S+/S ionic fraction take values between ∼45–70%). Table A.3 lists these results.
For the remaining regions, we derived empirical sulphur abundances using the S23 parameter and the calibration of Díaz & Zamora (2022). The median sulphur abundance derived using this empirical method is 12+log(S/H) = 6.42, which is significantly lower than the values obtained from the direct method. However, we note that the empirical S23 calibration may be affected by the effective temperature of the ionising radiation, particularly at high abundances. As discussed by Díaz & Zamora (2022, see Sec. 5.3), lower effective temperatures can shift the calibration towards higher abundances by up to 14% in the logarithm. Consequently, given the high sulphur abundances found in the CNSFRs of this ring from the direct method determination, it is likely that we have underestimated the abundances in the regions where the auroral line was not detected. The resulting sulphur abundances for all objects in our sample are listed in Table A.4.
4. Discussion
4.1. Ionisation nature
According to Kolcu et al. (2023, see Fig. 11), the emission line ratios in the ring are consistent with the predictions of star forming models. However, this galaxy hosts a low-luminosity active galactic nucleus (LINER) with a bolometric luminosity of Lbol = 6.2 × 1041 erg/s (Prieto et al. 2010; Fernández-Ontiveros et al. 2023), Lbol = 8.6 × 1041 erg/s (Nemmen et al. 2006), as well as four optical jets extending radially from the nucleus (Wolstencroft & Zealey 1975; Arp 1976; Lorre 1978). These jets occur in two opposite pairs and reach projected distances of up to ∼90 kpc. In our optical spectroscopic observations, we detected signatures of two of these jets, suggesting that AGN-driven processes may also contribute to the observed gas excitation in certain regions of the galaxy close to our nuclear ring. Therefore, before analysing the CNSFRs, we first verified if the origin of the emission is purely due to star formation processes.
The top left panel of Fig. 4 shows the spatial distribution of the [OIII]λ 5007 Å /[NII]λ 6584 Å ratio. Two arc structures with enhanced ratios, consistent with shocked gas, are clearly identified in the direction of one of the jet pairs (previously noted in Sec. 3.1). To study these features, we defined two elliptical apertures encompassing the arcs: (a) centred at RA = 116.92 deg, Dec = 293.17 deg, with PA = 210 deg, a = 3.64 arcsec, b = 1.96 arcsec; and (b) centred at RA = 209.32 deg, Dec = 93.97 deg, with a = 5.4 arcsec, b = 2.6 arcsec. We also identified a region of high ratio values in the lower clumps withing the circumnuclear ring, defining an additional circular aperture (c) centred at RA = 184.24 deg, Dec = 146.53 deg with radius r = 1.2 arcsec, together with a similar circular aperture at the galaxy centre. The integrated spectra extracted from all these apertures are shown in the top right panels of Fig. 4, where we applied the same fitting procedure described in Sec. 3.3 to measure the emission lines present in them. The spectrum corresponding to the galaxy nucleus is shown at the bottom panel, marked with an asterisk, and shows characteristics of a mild activity.
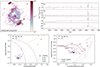 |
Fig. 4. Upper-left panel: Map of the observed [OIII]λ 5007 Å /[NII]λ 6584 Å ratio. Upper-right panel: Emission line spectra of regions contaminated by the AGN emission (a, b, c) and the LINER nucleus of the galaxy (*). Lower-left panel: [OIII]/Hβ vs. [NII]/Hα diagnostic diagram. Over-plotted are derived separations between LINER/Seyfert (S+07, Schawinski et al. 2007) and HII regions (K+01 and K+03, Kewley et al. 2001; Kauffmann et al. 2003). Lower-right panel: [SII]/Hα–[SIII]/Hα diagnostic diagram. Over-plotted are dust-free AGN photoionisation models (G+04, Groves et al. 2004) and star-forming models by Zamora & Díaz (2023). |
Actually, already more than 50 years ago, Smith (1972) noted that the [NII]/Hα intensity ratio changed from less than 1 in the HII regions in the ring to a value of greater than 1 in the nucleus, something that was confirmed by Meaburn et al. (1981) together with the finding of very broad (∼500 km/s) profiles of the optical emission lines that pointed to the galaxy having a Seyfert type 2 nucleus, although some years later Keel (1983) classified it as a LINER.
Ten years later, Storchi-Bergmann et al. (1993) reported the appearance of a very broad component in the Hα and Hβ emission lines, first observed in Hα in 1991 November 2, and confirmed 11 months later, with FWZI about 21 000 km/s and a double-peaked profile. The data also suggested the presence of a blue, featureless continuum in the nucleus. The Hα/Hβ flux ratio indicated that the broad- line region (BLR) was not significantly reddened. This finding pointed out to the presence of a Seyfert 1 nucleus that had not been seen before. The authors discussed different alternatives that could give rise to the observed profile (biconical outflow and an accretion disc) and speculated on the possible relationship between the broad line region and the previously known optical jets.
Storchi-Bergmann et al. (1995) presented a series of spectroscopic observations to follow up the evolution of the nuclear BLR spanning the period 1991–1994, finding that the broad component of Hα had varied significantly, both in flux, decreasing by a factor of two, and in its profile shape, which became more symmetrical than originally observed. While the first effect could be interpreted as a consequence of either increased obscuration along the line of sight or a decline in the ionising continuum. The second one was difficult to account for, and no preferred scenario was proposed.
At present, the nucleus of NGC 1097 is classified as Seyfert 1 (see top right pannel of Fig. 4). The mass of the supermassive massive black hole in its centre has been estimated by Onishi et al. (2015) from observations of dense molecular gas dynamics traced with HCN(J = 1 − 0) and HCO+(J = 1 − 0) emission lines yielding a value of 1.4 × 10⁸ M⊙.
Given the variability nature and the complex evolution of the nuclear region, we used the classical BPT diagnostic diagram to test the nature of the CNSFRs as shown in the lower left panels of Fig. 4. The BPT diagnostic diagram (Baldwin et al. 1981) uses the emission line ratios [NII]λ 6584 / Hα and [OIII]λ 5007/Hβ. In this diagram, we also plotted the ratios measured in the spectra of the apertures defined above. The star forming regions occupy the high-metallicity end of the empirical star-forming sequence defined by Kauffmann et al. (2003), as expected for circumnuclear enriched environments (see also Kolcu et al. 2023). In contrast, the arc structures identified in the [OIII]/[NII] maps clearly deviate from the purely photoionisation area. Instead, they present a shock-driven ionisation contribution placed them into the intermediate zone between the LINER and Seyfert classifications (Schawinski et al. 2007). This result is consistent with the known presence of an active nucleus and extended jets in this galaxy, which may interact with the surrounding interstellar medium and locally enhance the excitation of the gas.
Finally, the lower right panel of the same figure presents an additional diagnostic diagram based on the near-infrared sulphur emission lines, which provide a powerful tool for distinguishing between shock and photoionisation mechanisms (Diaz et al. 1985). This diagnostic is particularly suitable for our regions because it is not sensitive to the N/O ratio, difficult to estimate for CNSFRs, and is almost insensitive to reddening effects. The position of our regions in this plot is compatible with star formation excitation but they exhibit [SII]λλ6717,31/Hα ratios lower than those typically found in other CNSFRs (see Zamora & Díaz 2023, 2025). Interestingly, despite their higher abundances, these regions occupy the lower part of the diagram. This may reflect the double valued behavior of some abundance parameters (e.g. O23, S23), suggesting that our regions lie on the upper branch of these calibrations.
4.2. Supersolar CNSFR abundances
The high sulphur abundances derived for the CNSFRs in this study are not isolated cases in the literature. The highest sulphur abundance reported so far was measured in region 11 of NGC 5236, placed in the central region of M83 (Bresolin et al. 2005). For this HII region, the authors derived an electron temperature of Te([SIII]) = 4800 ± 200 K. Also Díaz & Zamora (2022) obtained for this region a temperature of 4858 ± 338 K, fully consistent with the former value within the quoted uncertainties. The corresponding sulphur abundances reported in these two works are 12+log(S/H) = 7.71 and 7.82, respectively. This remarkable concordance between independent determinations strongly supports the reliability of the sulphur abundance estimates and indicates that such elevated values are realistic in the central, metal-rich environments of galaxies.
In this work, we found one region, R6 with a the lowest measured S++ temperature Te([SIII]) = 3912 ± 567 K. Hence, this region has the highest sulphur abundance known up to date, with a value of 7.875 ± 0.353 which corresponds to more than five times the solar value.
We used the code CLOUDY (Ferland et al. 2013) to run photoionisation models in order to further support the reliability of our high sulphur abundances determinations and to deeper understand the underlying physical conditions of these regions. These models were constructed using the physical properties derived for those regions where the auroral [SIII]λ 6312 Å line was detected, allowing us to directly compare the predicted emission line flux ratios with our observations. We assumed an ionisation-bounded nebula with a plane-parallel geometry. The computed models adopt ionisation parameter values of log(u) = −3.0 and −2.5, an electron density of ne = 100 cm−3, and metallicities of 12+log(S/H) = 6.5, 7.1, 7.3, 7.4, 7.5, and 7.6, assuming that the stellar metallicity is the same as that of the gas. The nebula is ionised by a young stellar cluster synthesised using the POPSTAR code (Mollá et al. 2009), adopting a Salpeter initial mass function (Salpeter 1955) with lower and upper mass limits of 0.85 and 120 M⊙, respectively, and including the nebular continuum in a self-consistent way. We selected stellar cluster ages of 4, 5, and 6 Myr in order to cover a range of young stellar populations both with and without significant Wolf–Rayet (WR) emission, which change the effective temperature of the cluster.
Figure 5 shows the empirical S23 calibration together with red and blue contours corresponding to data for disc HII regions and HII galaxies respectively from Díaz & Zamora (2022). The individual purple symbols show the measurements of the 11 CNSFRs in this work with auroral [SIII] line detection. The Cloudy models computed for these regions appear superimpose for different ages and ionisation parameters with different colours and line styles. The models reproduce well the observed measurements, with the highest sulphur abundances being consistent with models that assume younger stellar populations. Furthermore, the models show that, at such high metallicities, the behavior of the empirical S23 calibration changes in a similar way to the well known turnover of the oxygen R23 calibration at subsolar metallicities (Pagel et al. 1979). In this high-abundance regime, the calibration becomes primarily dependent on the effective temperature of the ionising radiation rather than on the ionisation parameter (see Section 5.3 of Díaz & Zamora 2022), a trend now supported not only by observations but also by photoionisation models.
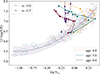 |
Fig. 5. S23 abundance calibration from Díaz & Zamora (2022). Red contours correspond to disc HII regions while blue contours correspond to HII galaxies. Purple dots represent the CNFSRs analysed in this work. The Cloudy models described in the text appear superimposed. |
Although the derived abundance values may appear extreme, it is important to note that these CNSFRs have been observed previously in the literature. Phillips et al. (1984) obtained long-slit spectra with the Image Photon Counting System (IPCS) at the 3.9 m Anglo-Australian Telescope (AAT), targeting both the circumnuclear ring and the central region of this galaxy (PA = 57°, perpendicular to the bar). In these data, the continuum spectrum in the central part of the galaxy is indistinguishable from that of an elliptical galaxy, showing spectral features typical of an evolved, high abundance stellar population (i.e. NGC 7145, CaII, band G, MgIb and NaID). The continuum within the ring was found to be very blue, with the Balmer series clearly detected in absorption, in agreement with our CNSFR spectra and consistent with a young population of hot stars.
From the analysis of relative emission-line intensities, Phillips et al. (1984) concluded that the circumnuclear ring regions exhibit properties typical of those in the most metal rich HII regions found in the discs of spiral galaxies, similar to the regions I and III observed in M83 (Dufour et al. 1980). Using the calibration of Pagel & Edmunds (1981), they derived oxygen abundances approximately three times the solar value, with log(O/H) = 9.40 and 9.28 for the NE and SW regions respectively (assuming log(O/H)⊙ = 8.92). Phillips et al. (1984) also found a slightly supersolar nitrogen to oxygen ratio, with log(N/O) = 0.77 and 0.87 for the NE and SW regions, respectively. These measurements are consistent with ours in the sense that this work also finds a very high metallicity content in the ionised gas. Moreover, it constitutes an independent determination, as it was based on the ratio ([OII]λλ3727,3729 + [OIII]λλ4959,5007)/Hβ, which involves bluer wavelengths, lines with different ionisation potentials, and is more strongly affected by dust extinction effects.
Unfortunately, our wavelength coverage does not include the [OII] emission line, so it does not allow us to make a direct comparison with the results of Phillips et al. (1984). However, we can exploit the commonly used N2 parameter, defined as log([NII]λλ6584/Hα) (Denicoló et al. 2002), to obtain an additional independent abundance determination from our data. Then, we used the disc HII regions and HII galaxies presented in (Díaz & Zamora 2022) to produce a calibration between N2 and the sulphur abundance. Figure 6 shows the empirical N2 calibration from Denicoló et al. (2002), shown as a dashed purple line, scaled under the assumption of a constant S/O solar ratio (≃ − 1.7, Asplund et al. 2009). For comparison, we also include the disc HII regions, HII galaxies and the Cloudy models used in Fig. 5, adopting the same colour coding and symbols. It is evident that the calibration also remains valid when sulphur is used as abundance tracer.
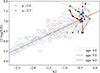 |
Fig. 6. N2 abundance calibration with the sulphur abundance. Red contours correspond to disc HII regions while blue contours correspond to HII galaxies. Purple dots represent the CNFSRs analysed in this work. The Cloudy models described in the text appear superimposed. The calibration from Denicoló et al. (2002) is also show, assuming log(S/O)⊙ ≃ −1.7 (Asplund et al. 2009). |
It is important also to remark that the N2 parameter exhibits a large dispersion at high abundances. In contrast to the sulphur calibration, this dispersion appears to be driven not only by the effective temperature of the ionising stellar population but also by variations in the ionisation parameter. Consequently, the turnover observed at these metallicities cannot be easily corrected, introducing an additional source of uncertainty in metal rich regimes. This index has been shown to follow a linear relation with log(O/H) at least over the range 7.2 < 12+log(O/H) < 9.1 (Denicoló et al. 2002) which correspond with an upper limit of log(S/H) ∼ 7.4. Then, as in the case of the sulphur measurements, our regions we are underestimating the abundances in the regions where the auroral line was not detected.
The sulphur abundances derived with the direct method (purple dots) show a good agreement with the predictions of the photoionisation models reinforcing the reliability of our measurement. Interestingly, the regions with the highest abundances are well reproduced by models that assume younger stellar populations (4 Myr), as in the case of the S23 calibration. In particular, they lie in the region of models with the lower ionisation parameters (log(u)∼ − 3).
Several studies in the literature have investigated the stellar populations of this nuclear ring. Particularly, Gadotti et al. (2019), using the same dataset analysed in the present work, reported that the young nuclear ring in NGC 1097 exhibits the lowest metal content in the central part of the galaxy (< 50 arcsec, see their Fig. 5 and also Fig. 4 in Bittner et al. 2020). This result is not compatible with the metallicity values derived from the ionised gas, both in this work and in previous studies cited during the discussion. The authors report stellar metallicities as low as [M/H] ∼ −1.57 (∼3% solar), a value incompatible with the oxygen and sulphur gas measurements that consistently indicate supersolar abundances. Since the ionising stars (< 10 Myr) form directly from this gas, their metallicities cannot be significantly lower than solar.
However, a recent study by Sextl & Kudritzki (2026) found that the young stars in this star-forming ring, as well as in other similar ones (NGC 7552, NGC 613, and NGC 335), exhibit supersolar stellar abundances. They performed a pixel-by-pixel SED fitting using the same dataset employed in the previous work, adopting the MILES stellar library (Sánchez-Blázquez et al. 2006), MESA stellar evolution isochrones (Dotter 2016; Choi et al. 2016), and a Chabrier initial mass function (Chabrier 2003). However, they realised that the commonly used empirical MILES library includes only stars with temperatures above 9000 K, which is not adequate to describe the complex environments of star-forming nuclear rings. To address this, they extended MILES with additional stellar libraries for hot and post-main-sequence stars (see Sextl et al. 2024; Sextl & Kudritzki 2026), incorporating hot massive stars, Wolf–Rayet stars, AGB and post-AGB stars, and carbon stars (Eldridge et al. 2017; Lançon & Wood 2000; Aringer et al. 2009; Rauch 2003; Smith et al. 2002). This improved approach, better suited to the particular characteristics of CNSFRs, revealed metallicities two to three times higher than solar, fully consistent with our results.
4.3. Ionising cluster characteristics
The number of hydrogen-ionising photons (Q(H0)) in each HII region was calculated from their extinction-corrected Hα luminosities (see Equation (16) in Zamora & Díaz 2023), assuming a distance of 14.5 Mpc (see Table 1). The related equation was derived using the recombination coefficient of the Hα line assuming a constant value of electron density of 100 cm−3, a temperature of 104 K and case B recombination (Osterbrock & Ferland 2006).
The HII regions show logarithmic Hα luminosities ranging from 38.79 to 40.56, with a median value of log L(Hα) = 40.04. This corresponds to a logarithmic number of ionising photons between 50.66 and 52.43, with a mean value of log(Q(H0)) = 51.90. The upper panel of Fig. 7 shows the distribution of these results. These luminosities are comparable to those observed in the outer ring of NGC 7469 and to the most luminous CNSFRs identified in NGC 7742, despite the closer distance to NGC 1097. However, the regions in the inner ring of NGC 7469 remain about an order of magnitude more luminous.
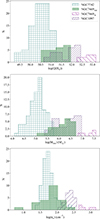 |
Fig. 7. Different histograms for the ring HII regions showing the distributions of the number of hydrogen ionising photons, the ionising mass of the clusters, and the electron density (upper, middle, and lower panels, respectively). |
We used the relation proposed by Zamora & Díaz (2023, see Equation 30) between the EW(Hβ) and the number of ionising photons to estimate the ionising stellar masses of our circumnuclear HII regions. The Hβ equivalent widths range from 5.8 to 19.5 Å, corresponding to ages between 5.56 Myr and 6.86 Myr for a single burst of star formation, based on PopStar models (Mollá et al. 2009) assuming a Salpeter initial mass function (IMF; Salpeter 1955) with lower and upper mass limits of 0.85 and 120 M⊙, respectively. The derived ionising masses range from 2.40 × 10⁵ M⊙ to 9.27 × 10⁶ M⊙, with a median value of 2.79 × 10⁶ M⊙ (see middle panel of Fig. 7). Then, the total ionising stellar mass in the entire ring is 7.74 × 10⁷ M⊙.
All our regions have masses larger than 104 M⊙, and hence the IMF is assumed to be fully sampled (Garcia Vargas & Diaz 1994; Villaverde et al. 2010). Our derived values are consistent with those obtained by Díaz et al. (2007) for the CNSFRs in NGC 2903, NGC 3351, and NGC 3504, higher than those measured in NGC 7742, and lower than those found in NGC 7469. However, these results should be considered as lower limits to the ionising masses, since we assume that (i) there is not dust photon absorption and re-emission at infrared wavelengths, and (ii) there is not ionising photon escape from the HII regions.
The electron density was derived from the [SII]λ6717/[SII]λ6731 ratio, which is sensitive to densities above ne = 50 cm−3, using PyNeb (Luridiana et al. 2015). Since this ratio shows a slight dependence on temperature, we adopted the mean Te(SIII) value of 5.486 K, obtained from regions with direct electron temperature measurements. All regions in our sample show densities above this lower limit, ranging from 107 ± 29 cm−3 to 385 ± 37 cm−3, with a mean value of 243 cm−3. The lower panel of Fig. 7 shows these results. However, although higher than in those found in other CNSFRs, these values remain in the lower limit for densities derived using the [SII] diagnostic.
An important parameter to characterise HII regions is the ionisation parameter, u, which serves as a proxy for the velocity of their ionisation fronts. The dimensionless ionisation parameter is commonly derived from the [SII]/[SIII] ratio. We obtained a range of values −0.061 < log([SII]/[SIII]) < 0.589 in the circumnuclear regions analysed in this work. Other high metallicity CNSFRs reported in the literature also exhibit large [SII]/[SIII] ratios (log([SII]/[SIII]) ∼ 0.1–0.6), a behavior not observed in typical high metallicity HII regions (Díaz et al. 2007). The authors suggest that the temperature of the ionising source could explain this behavior, with CNSFRs exhibiting a harder radiation field compared to other high-metallicity HII regions. They point out these CNSFR could be affected by hard radiation coming from a low luminosity AGN due to their proximity to the galactic nuclei. However this is not the case of the presented galaxy.
Using the relation proposed by Diaz et al. (1991), we obtained ionisation parameters from −3.98 to −2.89, with a median value of −3.42. However, as shown in Section 4.1 (see Fig. 4), these high metallicity regions exhibit a noticeable deficiency in the [SII] λλ 6717, 6731 Å emission lines. Therefore a revision of this diagnostic is required. To test this issue, we compared the ionisation parameter values with quantities that can be measured independently of the [SII] emission lines. In particular, we compared the physical sizes of the HII regions, derived directly from the segmentation performed on the Hα flux map (see Section 3.2), with those estimated from the definition of the ionisation parameter.
We estimated the angular radii of the observed ring HII regions, ϕ, using the Hα fluxes, the electron density, and the ionisation parameter calculated from the [SII]/[SIII] ratio (see Castellanos et al. 2002; Zamora & Díaz 2023). Figure 8 shows the comparison between the angular radii derived from the ionisation parameter and those measured directly from the Hα segmentation. The regions do not lie along the one to one relation expected for ionisation bounded HII regions. Instead, the measured angular radii are systematically smaller than those predicted from the ionisation parameter, with the HII regions following a clear linear trend. Moreover, this behavior cannot be explained by ionising photon escape since, in that case, the HII regions would lie above the one-to-one relation, instead of below it.
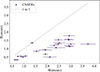 |
Fig. 8. Ionisation derived angular radius against the angular radius measured from the HII region segmentation (see Sect. 3.2). |
Only one region, R1, lies within the area expected for ionisation bounded nebulae. However, in the Hα emission map, we detect a possible overlap between this ionised region and a nearby one, which could artificially increase the measured radius without significantly affecting the Hα flux. Additionally, we tried to force the segmentation procedure to select larger HII regions by decreasing the background threshold in the Hα emission map. However, this new procedure did not resolve the discrepancy. Instead, it shifted the regions diagonally toward the upper right part of the plot.
In previous studies of other circumnuclear rings in this series of papers, we observed different behaviors of their HII regions. In NGC 7742, the CNSFRs are ionisation bounded, with all measured radii consistent with those estimated from the ionisation parameter, ϕ (Zamora & Díaz 2023). In contrast, the CNSFRs in both rings of NGC 7469 appear consistent with bubbles inflated by stellar winds originating from Wolf–Rayet stars (Zamora & Díaz 2025). The main difference between NGC 1097 and these two example galaxies is the higher density in its CNSFRs, which apparently is related to the [SII]/[SIII] ratio.
We calculated the ionisation parameter using its definition, u = Q(H0)/(4πcneR2), obtaining values between −3.045 and −2.505 in logarithmic scale. These values are systematically higher than those derived previously using the empirical calibration by Diaz et al. (1991). Figure 9 shows the ionisation parameter as a function of the [SII]/[SIII] emission-line ratio, with the empirical calibration previously used for comparison. In order to better understand the relation between the [SII]/[SIII] ratio at high metallicities, we used the CLOUDY photoionisation models described in Section 4.2. To explore the dependence on the effective temperature of the ionising source, we selected stellar cluster ages of 2, 4, and 6 Myr, representing populations both without and with significant Wolf–Rayet (WR) emission. In the models implemented (Mollá et al. 2009), the WR stars appear around 4 Myr. We adopted four values for the ionisation parameter, log(u) = −3.5, −3.0, −2.5, and −2.0, and three metallicities, 12 + log(S/H) = 6.72, 7.12, and 7.40 (corresponding to 0.4, 1, and 2 times the solar value respectively), assuming that the stellar metallicity is equal to that of the gas. These photoionisation models are also overplotted in Figure 9.
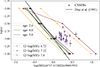 |
Fig. 9. Ionisation parameter derived using the angular radius measured from the HII region segmentation against the logarithmic [SII]/[SIII] emmision ratio. |
As anticipated, the HII regions analysed in this work are in the right part of the log(u)–[SII]/[SIII] calibration, implying that the ionisation parameter is systematically underestimated when derived it from this ratio. From the models, we observe a change in the trend for metallicities above solar, coinciding with the turnover point of the S23 calibration. While most models follow the relation established by Diaz et al. (1991), those with supersolar metallicities and without WR stars (2 and 5 Myr), and thus with stellar clusters with lower effective temperatures, exhibit higher [SII]/[SIII] ratios. The models with supersolar abundances and WR stars (at 4 Myr) appear to be consistent with the ionisation parameter calibration. Therefore, a change in the ionisation structure of HII regions with supersolar metallicities is the most plausible explanation for their elevated [SII]/[SIII] ratios.
Notably, this behavior is not exclusive to the [SII]/[SIII] ratio. The commonly used [OII]/[OIII] ratio also increases with metallicity, although this trend appears at lower abundances (see Figure 18 of Díaz et al. 2007). Therefore, a detailled study of the ionisation structure could provide valuable insights into the properties of these high metallicity ionising sources. In the following section, we explore alternative explanations related specifically to the ionisation conditions and structure (see Section 4.4).
Finally, the mass of ionised hydrogen, in solar masses, have be derived using the expression given in Diaz et al. (1991) and the ionisation parameter calculated from the definition. Their median mass is 1.1 × 10⁵ M⊙, covering a range of values between 6.8 × 10³ M⊙ and 2.7 × 10⁵ M⊙. The total mass of ionised hydrogen in the ring is ∼ 2.6 × 10⁶ M⊙.
Table A.5 (see Appendix A) shows the characteristics of each HII region and lists in Column 1–7: (1) the region ID; (2) the extinction-corrected Hα luminosity; (3) the number of hydrogen ionising photons; (4) the ionisation parameter estimated from the definition; (5) the electron density; (6) the mass of ionised hydrogen and (7) the ionising mass.
4.4. Temperature bounded emission
The empirical relation introduced in Diaz et al. (1991) between the ionisation parameter and the [SII]/[SIII] emission line ratio upholds for a wide range of observations. However, we present the first evidence, as far as we know, where the trend breaks, as seen in Figure 9. Since we compute the ionisation parameter using its definition, the further analysis would follow the [SII]/[SIII] shift in behavior at high metallicity. Although this emission line ratio is independent from abundance growth by definition, an increase in metal content could produce significant changes in the HII region structure and collisional exited line emissivities.
A more metallic young stellar population presents a softer ionising spectrum, which imposes a different ionisation structure once the recombination equilibrium is established. Similar to the Q(H0) parameter, one can define the Q(S1) as the number of ionising photons respect to the single ionised sulfur, whose ionszation potential is 23.34 eV. A decrement in Q(S1) leads to a shortening of the [SIII] emission part of the nebula and therefore produces an enlargement of the [SII] dominated region, which always extends to the very end of the nebula since the neutral sulfur ionisation potential (10.36 eV) is lower than the hydrogen one. This change in the recombination equilibrium between the two sulfur ionic species results in a higher [SII]/[SIII] ratio.
As we can see in Figure 10, the older the stellar population, the lower the Q(S1) and the bigger the low ionisation region became. Nevertheless, this trend is broken by the stellar population of 4 Myr old, since at this stage the spectrum is dominated by wolf-Rayet stars, whose effective temperature are much higher, setting the [SII]/[SIII] ratio back to the Diaz et al. (1991) relation.
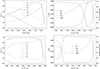 |
Fig. 10. Ionisation structures of the same Cloudy model presented in Figure 9. Their metallicity is log(S/H) = 7.4, the ionisation parameter is similar to the one found in our CNSFRs (log(u) = 3), and ages are 2 and 5 Myr, top and lower panels, respectively. In the right panels appear the oxygen and sulphur structures, while in the right panels we present the hydrogen and helium together with the electron temperature thought the nebula. |
Nonetheless, the fact that the two ionisation structures shown in Figure 10 generate a similar [SII]/[SIII] ratio is a truly surprising result. Whose interpretation requires a deeper understanding of the involved emission line formation processes.
Collisional de-excitation lines are forbidden atomic transitions triggered by the interaction of the ion with a free electron, resulting in the population of an excited state. Which, in the absence of further collisions, decays to a lower energy level emitting a photon. Additionally, free electrons in an HII region follow an Maxwell-Boltzmann distribution, characterised by the electron temperature (Te), being the only thermalised species in the nebula. Therefore, Te sets the collisional excitation rate for the rest of ionic species.
In general, the relation between the temperature of the electron distribution and the energy of the atomic transition can operate under three regimes. On the one hand, when the peak of the Maxwell-Boltzmann distribution exceeds the transition energy (1/2KTe > Ecel) the collisional excitation rate is low, since the transition is transparent for most of the electrons due to their high energy. On the other hand, when the electron temperature equals the transition energy (KTe ≂ Ecel) the collisional excitation rate reaches its maximum. Finally, when the electron distribution further shifts to lower temperatures the collisional excitation rate decrees, since a growing number of electrons do not have enough energy to excited the upper transition level; causing a temperature bounded emission regime. In the case of the [SII] 2D – 4S transition (λ6717 and λ6731 lines) the transition energy corresponds to 1.85 eV, from where we can divide the different boundaries of the three regimes approximately at Te ≳ 43 000 K and Te ≲ 5800 K. The former corresponds to the Te when the mode of the electron distribution equals the transition energy, while the latter is defined by the transition energy appearing more than two standard deviations away from the mean electron temperature ( ).
).
At the high metallicity regime, the metal cooling is higher and the electron temperature is low (∼5000 K), and thus the nebula operates in the later mentioned regime (3/2KTe < Ecel). Therefore, even though the S+ ion dominate the ionisation structure their emissivity is limited by the Te. There are just a few electrons from Maxwell-Boltzmann distribution that can excite the [SII] 2D – 4S transition in the low excitation part of the nebulae. This low collisional excitation rate explains the lesser increase in the [SII]/[SIII] ratio seen in Figure 9 as well as why the observations fall short in the [SII]/Hα ratio with respect to the models of Figure 4. Nonetheless, the effects of low electron temperature upon the collisional excitation line emission will benefit from further exploration in future works.
4.5. Comparison with previous studies
In this section, we compare our results with those from the most detailed photometric study to date, performed by Prieto et al. (2019), who used infrared-to-ultraviolet imaging with a spatial resolution of ∼10 pc. We also contrast our results with those obtained for the 14 regions selected in Brγ emission (IR) by Kotilainen et al. (2000), and the 10 regions identified using radio continuum emission at 1.465 GHz by Hummel et al. (1987) (see Section 3.2 for details). Table A.6 presents the identification of our regions with those reported by the comparison studies, along with some of the key properties discussed throughout this section.
In Prieto et al. (2019), they identified 247 individual star clusters within the ring with sizes of FWHM < 8 pc; 171 were detected in the UV and 76 at 0.8 μm. Assuming a density of 100 cm−3, a radius of 8 pc implies a number of ionising photons of log(Q(H0)) = 50.2, similar to that produced by single O4 – O5 stars (see Sternberg et al. 2003), while the number of ionising photons we measure is up to one order of magnitude higher. Therefore, when comparing our results with those of Prieto et al. (2019), it is important to note that their analysis primarily traces regions that may be ionised by individual massive stars, rather than by ionising clusters as in the present work. Moreover, while Prieto et al. (2019) directly analysed the stellar emission, our approach infers their physical properties indirectly through the analysis of the surrounding ionised gas emission. Due to the extremely high spatial resolution of their observations and the inherently different methodologies applied, we focused our comparison in the global properties of the regions in the ring, instead of a one by one cluster comparison.
The excitation mechanism of the hot molecular gas can be observed using the H2/Brγ ratios. In Kotilainen et al. (2000) (see Tab. A.6), this ratio ranges from 0.25 to 1.70, with an average value of 0.75, which can be explained by UV excitation from young massive stars (see Puxley et al. 1990). This result is consistent with our, where photoionisation processes successfully reproduce the [OIII]/[NII] emission ratios observed in the CNSFRs of the ring. Only two regions, K2 and K9, exhibit H2/Brγ ratios higher than 0.9. They are located at the opposite ends of the inner galaxy bar, and notably, they are not detected in the optical Balmer emission as shown in the present work. Also, the regions with higher H2/Brγ ratio are the ones with lower radio emission. A possible explanation is a higher gas density in them or an additional contribution from shock excitation, likely driven by supernova activity. This scenario is consistent with the idea of a propagating starburst that originates in the nucleus and extends toward the ends of the bar and into the circumnuclear ring through bar driven shocks. We found just a few clusters in the filaments that spiral to the centre or in the inner bulge, and none along the filaments outside the ring.
The dust extinction of the regions in the ring has been estimated by several authors using different indicators. From photometric studies, Barth et al. (1995) found a mean attenuation of AV = 1.1 mag using Hubble Space Telescope images. In Prieto et al. (2019), they derived an average extinction for the cluster continuum of AV < 1.5 mag, consistent with the very blue spectral slopes of the clusters. In contrast, the extinction associated with the interstellar medium is found to be slightly higher, with AV ∼ 2 − 3 mag, as inferred from extinction maps of the circumnuclear ring on kiloparsec scales. This is consistent with the extinction measured for the CNSFRs in this work (AV = 2.14 mag) and with the values derived from the Paα/Hα ratio reported by Prieto et al. (2019). Using Hα/Hβ emission, Hummel et al. (1987) reported 0.85 mag and 2.83 mag for the eastern and western parts of the ring respectively, Osmer et al. (1974) measured 0.56 mag for a northern region, Phillips et al. (1984) found 3.0 and 3.5 mag in two other regions, and Walsh et al. (1986) reported a range between 0.6 and 3.0 mag. Finally, Kotilainen et al. (2000) used the Brγ fluxes, obtained AV values between 0.1 and 2.2 mag, with an average of 1.3 mag. These measurements are broadly consistent with our results.
The ionised gas masses of the regions reported by Kotilainen et al. (2000) range from (1.7–8.5) × 106 M⊙, summing to a total of 5.1 × 10⁷ M⊙ for the ring, comparable to the value we derived, 7.74 × 10⁷ M⊙. In contrast, Prieto et al. (2019) estimated a lower total stellar mass formed in the ring over the past 20–100 Myr, of approximately 8 × 10⁶ M⊙. The mass associated with their young stellar population is ∼3 × 10⁶ M⊙, distributed among roughly 60 clusters with a mean mass of ∼5 × 10⁵ M⊙ per cluster (see their Fig. 4). If the mass of the additional 76 clusters detected but not analysed in that work is included, the total stellar mass increases to ∼1.5 × 10⁷ M⊙. This value is a factor of ∼2–4 lower than we inferred from the ionised gas, suggesting that the ionised gas traces a more efficient conversion of molecular gas into stellar mass. The molecular gas mass in the ring is M(H2) ∼109 M⊙, derived by Hsieh et al. (2011) from HCN observations, and by Gerin et al. (1988) from CO(J = 1 − 0). Prieto et al. (2019) found that the total mass of clusters formed represents less than 1% of this gas, whereas our results show that the ionising stellar mass (< 6 Myr) is ∼8% of the gas content of the ring.
The star formation rate (SFR) was calculated by Kotilainen et al. (2000) by comparing the observed quantities with models from Leitherer et al. (1999) and assuming an instantaneous star formation burst. They found the SFR for the star forming clumps are between 0.05 and 0.31 M⊙/yr, a total of 1.8 M⊙/yr within the ring. This last value is the same found by Prieto et al. (2019), calculated using the extinction corrected Paα emission map of the ring and the Kennicutt & Evans (2012) relation, and it is a factor 2.5 lower than previous estimate by Hummel et al. (1987, ∼5 M⊙). Taking into account the molecular mass gas, it implies a gas depletion time-scale, M(H2)/SFR, of 5 × 10⁸ yr. Additionally, with this SFR constant during the past 100 Myr, the total mas in clusters in the ring should be 2 × 10⁸ M⊙, which is more than one order of magnitude higher than the stellar mass they found within this age range. They also estimated a gas inflow rate of 3 M⊙/yr into the ring through the two dust lanes, and an additional 0.6 M⊙/yr inflow toward the nucleus through the inner spiral lanes. Then, the estimated gas consumption in the ring is 2.4 M⊙/yr, larger than the current star formation they found in the ring.
On the other hand, we calculated the SFR of the CNSFRs directly from the extinction corrected Hα emission using also the Kennicutt & Evans (2012) calibration, obtaining a total SFR of 2.34 M⊙/yr for all regions, value similar to the gas consumption estimated for the ring in Prieto et al. (2019). This suggests that the gas supply within the ring is the main factor regulating its star formation activity. At this rate, the ring would have produced ∼1.4 × 10⁷ M⊙ of stars over the past 6 Myr. Given the total ionising stellar mass derived, this implies that the recent star formation episode must have experienced an enhancement. We estimate a characteristic gas timescale of ∼4 × 10⁸ yr for this process.
Finally, Prieto et al. (2019) argue that the HII regions in this circumnuclear star-forming ring are optically thin, with a significant fraction of the ionised gas escaping the boundaries of individual clusters and mixing with the ionised gas. However, this scenario is not supported by the results of this work. From the comparison between the angular radii of the observed HII regions, ϕ, and those measured directly from the Hα segmentation, we show that the properties of our regions cannot be explained by ionising photon escape (see Sect. 4.3). Moreover, the gas we observe cannot originate from leaked ionising photons, as the measured emission line ratios are inconsistent with those typically associated with such diffuse media (see Sect. 4.1). In particular, the [SII]/Hα ratio in our regions has a mean value of 0.16, whereas warm ionised or diffuse ionised gas (WIM or DIG) typically exhibits values greater than 0.4. Similarly, the derived physical conditions as electron densities exceeding 100 cm−3 (ne ∼ 240 cm−3) and electron temperatures of Te ∼ 5480 K, are incompatible with those expected for diffuse ionised gas, which typically has ne ∼ 0.1 cm−3 and Te ∼ 10 000 K (see Reynolds 2004). We refer to Prieto et al. (2019) for an alternative discussion of this issue.
5. Summary and conclusions
In this work, we studied the ionised gas and the chemical abundances of the CNSFR within the ring of the barred spiral galaxy NGC 1097 using publicly available MUSE IFS observations which cover the optical rest frame part of the spectrum from 4800 to 9300 Å. Although this ring has been extensively studied both photometrically and spectroscopically over the past decades, using a variety of approaches and instruments across different wavelength ranges, the new IFS data provides a much better spatial resolution at optical wavelengths.
The Hα and [OIII] emission line maps reveal two distinct streams that coincide with the location of one of the jets observed in this galaxy. These arc-structures exhibit elevated [OIII]/[NII] ratios, consistent with shocked gas driven by the activity generated by its AGN. The continuum emission is originated from the centre of the galaxy, and two armed structures are clearly identified. The bar shows more prominently in the redder continuum, likely because it is dominated by an older stellar population, whereas the ionising star forming clusters show enhanced emission at bluer wavelengths, reflecting their young stellar populations.
The projected radial extent of the ring, derived from the pixel-by-pixel Hα radial profile, spans from approximately 385 pc to 1.3 kpc. Within this structure, we identified a total of 24 HII regions. We extracted the spectrum of each region and measured the fluxes of their main emission lines, including the auroral [SIII]λ6312 Å line, which was detected in approximately ∼45% of the regions. This allowed us to derive direct total sulphur abundances, with a median value close to the solar abundance, 12+log(S/H) = 7.11, and ionic fractions S+/S ranging between ∼45–70%. The highest measured abundance exceeds five times the solar value, with Te([SIII]) = 3912 ± 567 K and 12+log(S/H) = 7.88 ± 0.35, representing, to our knowledge, the highest sulphur abundance reported to date. Although this value may appear extreme, photoionisation models computed for this region successfully reproduce the observed line ratios, being consistent with models that assume young stellar populations (4 Myr) and low ionisation parameters (log(u) ∼ −3). In addition, the CNSFR in this galaxy exhibit high oxygen abundances, as previously reported in the literature, with log(O/H) = 9.40 and 9.28 (assuming log(O/H)⊙ = 8.92), as well as stellar metallicities two to three times higher than solar. Under such extreme conditions, commonly used empirical abundance diagnostics, such as O23 (commonly refer to as R23) and S23, are not readily applicable, since the regions lie on the upper branch, out of the range of both calibrations. Similarly, stellar abundance determinations must be treated with caution, requiring the inclusion of stellar populations with effective temperatures below 9000 K, which are the appropriate ones for describing the complex environments of star-forming nuclear rings.
The high metal content in these regions leads to significant changes in the ionisation structure and in the emissivities of collisionally excited lines. These effects alter the recombination equilibrium between the two sulphur ionic species, resulting in enhanced [SII]/[SIII] ratios. A similar behavior is also observed in the commonly used [OII]/[OIII] ratio, although this trend becomes apparent at lower metallicities.
We compared our results with those reported in the literature. The observed H2/Brγ ratios can be naturally explained by UV excitation from young massive stars, in agreement with our results. In particular, photoionisation processes are able to successfully reproduce the [OIII]/[NII] line ratios observed in the CNSFR. The dust extinction of the regions was estimated using different indicators. Values derived from photometric studies and from Brγ fluxes are lower than the mean extinction obtained in this work, whereas those inferred from the Hα/Hβ ratio are broadly consistent with our results (mean value AV = 2.14 mag). The ionised gas masses derived from the observed infrared emission sum to a total of 5.1 × 10⁷ M⊙ for the ring, which is comparable to the value obtained in this work, 7.74 × 10⁷ M⊙. The molecular gas mass in the ring is M(H2) ∼ 109 M⊙, as inferred from HCN and CO(J = 1–0) observations. Therefore, the mass in ionising stars younger than 6 Myr represents approximately ∼8% of the total gas content of the ring. The SFR reported by other authors for the individual star forming clumps range between 0.05 and 0.31 M⊙/yr, yielding a total SFR of 1.8 M⊙/yr within the ring. This value was obtained both by comparing the observed infrared quantities with model predictions and by using the extinction-corrected Paα emission map of the ring. However, the SFR directly derived in this work from the extinction-corrected Hα emission, yields a higher value, with a total SFR of 2.34 M⊙/yr for all regions. Our estimate is fully consistent with the expected gas consumption in the ring, given the gas inflow rate through the two dust lanes (3 M⊙/yr) against the subsequent inflow toward the nucleus through the inner spiral lanes (0.6 M⊙/yr).
In the following, we present our main conclusions and an overall picture of the circumnuclear ring:
-
Despite the activity and variability of the galaxy nucleus, no shock effects are observed in the CNSFR. This results in a complex, multi-epoch interaction between the core and the ring, while ensuring that the H II regions are purely photoionised, and hence the calculations performed in this work are valid.
-
The directly derived abundances reach four and five times the solar value, and photoionisation models computed for these regions successfully reproduce the observed line ratios. This extremely high-metallicity regime is present, but it has likely not been extensively studied because these regions lie out of the calibration range of commonly used abundance diagnostics, such as O23 and S23.
-
At these high abundances, we find a break in the ionisation-parameter–[SII]/[SIII] relation that cannot be explained by photon escape. However, changes in the ionisation structure and line emissivities explain the breakdown and the models support this interpretation. Also, the commonly used [OII]/[OIII] ratio shows this behavior although the trend appears at lower metallicities.
-
The starburst is generated in the galaxy nucleus and extends along the inner bar into a ring, generating socks at the ends. Young stars ionise 8% of the total gas in the ring, and the gas supply regulates its SFR.
After this work, the general picture of the circumnuclear ring has significantly evolved. The ring is composed of at least 24 star forming complexes, with the gas supply acting as the primary factor regulating its star formation activity. Multiwavelength studies support the idea of a propagating starburst that originates in the nucleus and extends toward the ends of the bar and into the circumnuclear ring through bar driven shocks, with the regions placed in the opposite ends of the bar not detected in the optical Balmer emission and exhibiting high H2/Brγ ratios. The metal content of the ionised regions is extremely high, reaching up to five times the solar value, as expected in the central regions of spiral galaxies. Finally, we likely detect optical signatures associated with one of the two known jets in this galaxy: two arc-structures that are consistent with shocked gas driven by AGN activity. This finding, together with the radio core emission previously found at sub-parsec scales, reflects the presence of feedback processes operating even on small galactic disc scales (< 1 kpc); however, the star formation occurring in the nuclear ring of this specific galaxy does not appear to be directly affected.
Acknowledgments
We thank A. Prieto for the useful discussion regarding our results in the context of her previous photometric study. This research has made use of the services of the ESO Science Archive Facility and NASA’s Astrophysics Data System Abstract Service. It is based on observations collected at the European Organisation for Astronomical Research in the Southern Hemisphere under ESO programme 097.B-0640(A) and data products created thereof. Also we have used observations obtained with the NASA/ESA HST and obtained from the Hubble Legacy Archive, which is a collaboration between the Space Telescope Science Institute (STScI/NASA), the Space Telescope European Coordinating Facility (ST-ECF/ESA), and the Canadian Astronomy Data Centre (CADC/NRC/CSA). This work has been funded by project Estallidos8 PID2022-136598NB-C33 funded by MCIN/AEI/10.13039/501100011033 and by “ERDF A way of making Europe”. SZ acknowledges support from the European Union (ERC, WINGS, 101040227).
References
- Aringer, B., Girardi, L., Nowotny, W., Marigo, P., & Lederer, M. T. 2009, A&A, 503, 913 [NASA ADS] [CrossRef] [EDP Sciences] [Google Scholar]
- Arp, H. 1976, ApJ, 207, L147 [Google Scholar]
- Asplund, M., Grevesse, N., Sauval, A. J., & Scott, P. 2009, ARA&A, 47, 481 [NASA ADS] [CrossRef] [Google Scholar]
- Bacon, R., Accardo, M., Adjali, L., et al. 2010, SPIE Conf. Ser., 7735, 773508 [Google Scholar]
- Baldwin, J. A., Phillips, M. M., & Terlevich, R. 1981, PASP, 93, 5 [Google Scholar]
- Barth, A. J., Ho, L. C., Filippenko, A. V., & Sargent, W. L. 1995, AJ, 110, 1009 [Google Scholar]
- Beirão, P., Armus, L., Appleton, P. N., et al. 2010, A&A, 518, L60 [NASA ADS] [CrossRef] [EDP Sciences] [Google Scholar]
- Bittner, A., Sánchez-Blázquez, P., Gadotti, D. A., et al. 2020, A&A, 643, A65 [NASA ADS] [CrossRef] [EDP Sciences] [Google Scholar]
- Bresolin, F., Schaerer, D., González Delgado, R. M., & Stasińska, G. 2005, A&A, 441, 981 [NASA ADS] [CrossRef] [EDP Sciences] [Google Scholar]
- Burbidge, E. M., & Burbidge, G. R. 1960, ApJ, 132, 30 [Google Scholar]
- Carter, D., Allen, D. A., & Malin, D. F. 1984, MNRAS, 211, 707 [NASA ADS] [Google Scholar]
- Castellanos, M., Díaz, A. I., & Terlevich, E. 2002, MNRAS, 337, 540 [NASA ADS] [CrossRef] [Google Scholar]
- Chabrier, G. 2003, PASP, 115, 763 [Google Scholar]
- Choi, J., Dotter, A., Conroy, C., et al. 2016, ApJ, 823, 102 [Google Scholar]
- Denicoló, G., Terlevich, R., & Terlevich, E. 2002, MNRAS, 330, 69 [CrossRef] [Google Scholar]
- Díaz, Á. I., & Zamora, S. 2022, MNRAS, 511, 4377 [CrossRef] [Google Scholar]
- Diaz, A. I., Pagel, B. E. J., & Wilson, I. R. G. 1985, MNRAS, 212, 737 [NASA ADS] [CrossRef] [Google Scholar]
- Diaz, A. I., Terlevich, E., Vilchez, J. M., Pagel, B. E. J., & Edmunds, M. G. 1991, MNRAS, 253, 245 [NASA ADS] [CrossRef] [Google Scholar]
- Díaz, Á. I., Terlevich, E., Castellanos, M., & Hägele, G. F. 2007, MNRAS, 382, 251 [CrossRef] [Google Scholar]
- Dors, O. L., Jr, Storchi-Bergmann, T., Riffel, R. A., & Schimdt, A. A. 2008, A&A, 482, 59 [NASA ADS] [CrossRef] [EDP Sciences] [Google Scholar]
- Dotter, A. 2016, ApJS, 222, 8 [Google Scholar]
- Dufour, R. J., Talbot, R. J., Jr, Jensen, E. B., & Shields, G. A. 1980, ApJ, 236, 119 [Google Scholar]
- Eldridge, J. J., Stanway, E. R., Xiao, L., et al. 2017, PASA, 34 [Google Scholar]
- Ferland, G. J., Porter, R. L., van Hoof, P. A. M., et al. 2013, Rev. Mex. Astron. Astrofis., 49, 137 [Google Scholar]
- Fernández-Ontiveros, J. A., López-López, X., & Prieto, A. 2023, A&A, 670, A22 [NASA ADS] [CrossRef] [EDP Sciences] [Google Scholar]
- Gadotti, D. A., Sánchez-Blázquez, P., Falcón-Barroso, J., et al. 2019, MNRAS, 482, 506 [Google Scholar]
- Garcia Vargas, M. L., & Diaz, A. I. 1994, ApJS, 91, 553 [NASA ADS] [Google Scholar]
- Gerin, M., Nakai, N., & Combes, F. 1988, A&A, 203, 44 [NASA ADS] [Google Scholar]
- Groves, B. A., Dopita, M. A., & Sutherland, R. S. 2004, ApJS, 153, 9 [NASA ADS] [CrossRef] [Google Scholar]
- Hsieh, P.-Y., Matsushita, S., Liu, G., et al. 2011, ApJ, 736, 129 [Google Scholar]
- Hummel, E., van der Hulst, J. M., & Keel, W. C. 1987, A&A, 172, 32 [NASA ADS] [Google Scholar]
- Kauffmann, G., Heckman, T. M., Tremonti, C., et al. 2003, MNRAS, 346, 1055 [Google Scholar]
- Keel, W. C. 1983, ApJ, 269, 466 [NASA ADS] [CrossRef] [Google Scholar]
- Kennicutt, R. C., & Evans, N. J. 2012, ARA&A, 50, 531 [NASA ADS] [CrossRef] [Google Scholar]
- Kewley, L. J., Dopita, M. A., Sutherland, R. S., Heisler, C. A., & Trevena, J. 2001, ApJ, 556, 121 [Google Scholar]
- Kolcu, T., Maciejewski, W., Gadotti, D. A., et al. 2023, MNRAS, 524, 207 [NASA ADS] [CrossRef] [Google Scholar]
- Kotilainen, J. K., Reunanen, J., Laine, S., & Ryder, S. D. 2000, A&A, 353, 834 [NASA ADS] [Google Scholar]
- Lai, T. S. Y., Armus, L., U, V., et al. 2022, ApJ, 941, L36 [NASA ADS] [CrossRef] [Google Scholar]
- Lançon, A., & Wood, P. R. 2000, A&AS, 146, 217 [NASA ADS] [CrossRef] [EDP Sciences] [Google Scholar]
- Leitherer, C., Schaerer, D., Goldader, J. D., et al. 1999, ApJS, 123, 3 [Google Scholar]
- Lorre, J. J. 1978, ApJ, 222, L99 [Google Scholar]
- Luridiana, V., Morisset, C., & Shaw, R. A. 2015, A&A, 573, A42 [NASA ADS] [CrossRef] [EDP Sciences] [Google Scholar]
- Martini, P., Regan, M. W., Mulchaey, J. S., & Pogge, R. W. 2003, ApJ, 589, 774 [NASA ADS] [CrossRef] [Google Scholar]
- Meaburn, J., Terrett, D. L., Theokas, A., & Walsh, J. R. 1981, MNRAS, 195, 39 [Google Scholar]
- Mezcua, M., & Prieto, M. A. 2014, ApJ, 787, 62 [NASA ADS] [CrossRef] [Google Scholar]
- Miller, J. S., & Mathews, W. G. 1972, ApJ, 172, 593 [NASA ADS] [CrossRef] [Google Scholar]
- Mollá, M., García-Vargas, M. L., & Bressan, A. 2009, MNRAS, 398, 451 [CrossRef] [Google Scholar]
- Mould, J. R., Huchra, J. P., Freedman, W. L., et al. 2000, ApJ, 529, 786 [Google Scholar]
- Nakajima, T., Takano, S., Tosaki, T., et al. 2023, ApJ, 955, 27 [NASA ADS] [CrossRef] [Google Scholar]
- Nemmen, R. S., Storchi-Bergmann, T., Yuan, F., et al. 2006, ApJ, 643, 652 [NASA ADS] [CrossRef] [Google Scholar]
- Ondrechen, M. P., van der Hulst, J. M., & Hummel, E. 1989, ApJ, 342, 39 [NASA ADS] [CrossRef] [Google Scholar]
- Onishi, K., Iguchi, S., Sheth, K., & Kohno, K. 2015, ApJ, 806, 39 [NASA ADS] [CrossRef] [Google Scholar]
- Orienti, M., & Prieto, M. A. 2010, MNRAS, 401, 2599 [NASA ADS] [CrossRef] [Google Scholar]
- Osmer, P. S., Smith, M. G., & Weedman, D. W. 1974, ApJ, 192, 279 [Google Scholar]
- Osterbrock, D. E., & Ferland, G. J. 2006, Astrophysics of Gaseous Nebulae and Active Galactic Nuclei (Sausalito, CA: University Science Books) [Google Scholar]
- Pagel, B. E. J., & Edmunds, M. G. 1981, ARA&A, 19, 77 [NASA ADS] [CrossRef] [Google Scholar]
- Pagel, B. E. J., Edmunds, M. G., Blackwell, D. E., Chun, M. S., & Smith, G. 1979, MNRAS, 189, 95 [NASA ADS] [CrossRef] [Google Scholar]
- Papadopoulos, P. P., & Allen, M. L. 2000, ApJ, 537, 631 [NASA ADS] [CrossRef] [Google Scholar]
- Pérez-Montero, E. 2017, PASP, 129, 043001 [CrossRef] [Google Scholar]
- Phillips, M. M., Pagel, B. E. J., Edmunds, M. G., & Diaz, A. 1984, MNRAS, 210, 701 [NASA ADS] [Google Scholar]
- Prieto, M. A., Maciejewski, W., & Reunanen, J. 2005, AJ, 130, 1472 [NASA ADS] [CrossRef] [Google Scholar]
- Prieto, M. A., Reunanen, J., Tristram, K. R. W., et al. 2010, MNRAS, 402, 724 [Google Scholar]
- Prieto, M. A., Fernandez-Ontiveros, J. A., Bruzual, G., et al. 2019, MNRAS, 485, 3264 [NASA ADS] [CrossRef] [Google Scholar]
- Puxley, P. J., Hawarden, T. G., & Mountain, C. M. 1990, ApJ, 364, 77 [CrossRef] [Google Scholar]
- Rauch, T. 2003, A&A, 403, 709 [NASA ADS] [CrossRef] [EDP Sciences] [Google Scholar]
- Reynolds, R. J. 2004, Adv. Space Res., 34, 27 [Google Scholar]
- Rodríguez-Baras, M., Fuente, A., Riviére-Marichalar, P., et al. 2021, A&A, 648, A120 [NASA ADS] [CrossRef] [EDP Sciences] [Google Scholar]
- Salpeter, E. E. 1955, ApJ, 121, 161 [Google Scholar]
- Sánchez, S. F., Pérez, E., Rosales-Ortega, F. F., et al. 2015, A&A, 574, A47 [NASA ADS] [CrossRef] [EDP Sciences] [Google Scholar]
- Sánchez-Blázquez, P., Peletier, R. F., Jiménez-Vicente, J., et al. 2006, MNRAS, 371, 703 [Google Scholar]
- Schawinski, K., Thomas, D., Sarzi, M., et al. 2007, MNRAS, 382, 1415 [Google Scholar]
- Sérsic, J. L., & Pastoriza, M. 1965, PASP, 77, 287 [CrossRef] [Google Scholar]
- Sextl, E., & Kudritzki, R.-P. 2026, ApJ, 997, 329 [Google Scholar]
- Sextl, E., Kudritzki, R.-P., Burkert, A., et al. 2024, ApJ, 960, 83 [Google Scholar]
- Skrutskie, M. F., Cutri, R. M., Stiening, R., et al. 2006, AJ, 131, 1163 [NASA ADS] [CrossRef] [Google Scholar]
- Smith, M. G. 1972, Bull. Am. Astron. Soc., 4, 237 [Google Scholar]
- Smith, L. J., Norris, R. P. F., & Crowther, P. A. 2002, MNRAS, 337, 1309 [CrossRef] [Google Scholar]
- Sternberg, A., Hoffmann, T. L., & Pauldrach, A. W. A. 2003, ApJ, 599, 1333 [NASA ADS] [CrossRef] [Google Scholar]
- Storchi-Bergmann, T., Baldwin, J. A., & Wilson, A. S. 1993, ApJ, 410, L11 [NASA ADS] [CrossRef] [Google Scholar]
- Storchi-Bergmann, T., Eracleous, M., Livio, M., et al. 1995, ApJ, 443, 617 [NASA ADS] [CrossRef] [Google Scholar]
- Talent, D. L. 1982, PASP, 94, 36 [Google Scholar]
- Telesco, C. M., & Gatley, I. 1981, ApJ, 247, L11 [Google Scholar]
- Villaverde, M., Cerviño, M., & Luridiana, V. 2010, A&A, 522, A49 [NASA ADS] [CrossRef] [EDP Sciences] [Google Scholar]
- Walsh, J. R., Nandy, K., Thompson, G. I., & Meaburn, J. 1986, MNRAS, 220, 453 [Google Scholar]
- Weilbacher, P. M., Streicher, O., Urrutia, T., et al. 2014, ASP Conf. Ser., 485, 451 [NASA ADS] [Google Scholar]
- Wolstencroft, R. D., & Zealey, W. J. 1975, MNRAS, 173, 51P [Google Scholar]
- Wolstencroft, R. D., Tully, R. B., & Perley, R. A. 1984, MNRAS, 207, 889 [NASA ADS] [Google Scholar]
- Zamora, S., & Díaz, Á. I. 2023, MNRAS, 525, 5767 [NASA ADS] [Google Scholar]
- Zamora, S., & Díaz, A. I. 2025, A&A, 696, A21 [NASA ADS] [CrossRef] [EDP Sciences] [Google Scholar]
Appendix A: Tables
The CNSFR characteristics.
Reddening corrected emission line intensities.
Ionic and total sulphur abundances derived by the direct method for the CNSFRs with measured [SIII]λ 6312 Å line intensities.
Sulphur abundances of the observed CNSFRs derived by empirical methods.
Characteristics of the observed CNSFRs.
Comparison between our results and those from Kotilainen et al. (2000, K00) and Hummel et al. (1987, H87), in infrared and radio wavelengths respectively.
All Tables
Ionic and total sulphur abundances derived by the direct method for the CNSFRs with measured [SIII]λ 6312 Å line intensities.
Comparison between our results and those from Kotilainen et al. (2000, K00) and Hummel et al. (1987, H87), in infrared and radio wavelengths respectively.
All Figures
|
Fig. 1. From left to right and top to bottom: Maps of the observed Hα and [OIII]λ5007 Å emission line fluxes (in units of 10−20 erg/s/cm2 and logarithmic scale); AV extinction (in magnitudes); observed continuum fluxes in the blue and red parts of the spectrum (5400 Å and 8150 Å respectively), in units of 10−17 erg/s/cm2 and logarithmic scale); and EW(Hα) in Å. Orientation: North is up and east is to the left. |
| In the text | |
|
Fig. 2. HII regions selected using our segregation program on the Hα observed emission line map. The aperture used to define the ring for the segregation of the regions is overplotted in blue. A logarithmic colour scale is used. Orientation: North is up, east is to the left. The physical scale is represented at the bottom left corner of the map. |
| In the text | |
|
Fig. 3. Extracted spectrum of region R2. |
| In the text | |
|
Fig. 4. Upper-left panel: Map of the observed [OIII]λ 5007 Å /[NII]λ 6584 Å ratio. Upper-right panel: Emission line spectra of regions contaminated by the AGN emission (a, b, c) and the LINER nucleus of the galaxy (*). Lower-left panel: [OIII]/Hβ vs. [NII]/Hα diagnostic diagram. Over-plotted are derived separations between LINER/Seyfert (S+07, Schawinski et al. 2007) and HII regions (K+01 and K+03, Kewley et al. 2001; Kauffmann et al. 2003). Lower-right panel: [SII]/Hα–[SIII]/Hα diagnostic diagram. Over-plotted are dust-free AGN photoionisation models (G+04, Groves et al. 2004) and star-forming models by Zamora & Díaz (2023). |
| In the text | |
|
Fig. 5. S23 abundance calibration from Díaz & Zamora (2022). Red contours correspond to disc HII regions while blue contours correspond to HII galaxies. Purple dots represent the CNFSRs analysed in this work. The Cloudy models described in the text appear superimposed. |
| In the text | |
|
Fig. 6. N2 abundance calibration with the sulphur abundance. Red contours correspond to disc HII regions while blue contours correspond to HII galaxies. Purple dots represent the CNFSRs analysed in this work. The Cloudy models described in the text appear superimposed. The calibration from Denicoló et al. (2002) is also show, assuming log(S/O)⊙ ≃ −1.7 (Asplund et al. 2009). |
| In the text | |
|
Fig. 7. Different histograms for the ring HII regions showing the distributions of the number of hydrogen ionising photons, the ionising mass of the clusters, and the electron density (upper, middle, and lower panels, respectively). |
| In the text | |
|
Fig. 8. Ionisation derived angular radius against the angular radius measured from the HII region segmentation (see Sect. 3.2). |
| In the text | |
|
Fig. 9. Ionisation parameter derived using the angular radius measured from the HII region segmentation against the logarithmic [SII]/[SIII] emmision ratio. |
| In the text | |
|
Fig. 10. Ionisation structures of the same Cloudy model presented in Figure 9. Their metallicity is log(S/H) = 7.4, the ionisation parameter is similar to the one found in our CNSFRs (log(u) = 3), and ages are 2 and 5 Myr, top and lower panels, respectively. In the right panels appear the oxygen and sulphur structures, while in the right panels we present the hydrogen and helium together with the electron temperature thought the nebula. |
| In the text | |
Current usage metrics show cumulative count of Article Views (full-text article views including HTML views, PDF and ePub downloads, according to the available data) and Abstracts Views on Vision4Press platform.
Data correspond to usage on the plateform after 2015. The current usage metrics is available 48-96 hours after online publication and is updated daily on week days.
Initial download of the metrics may take a while.