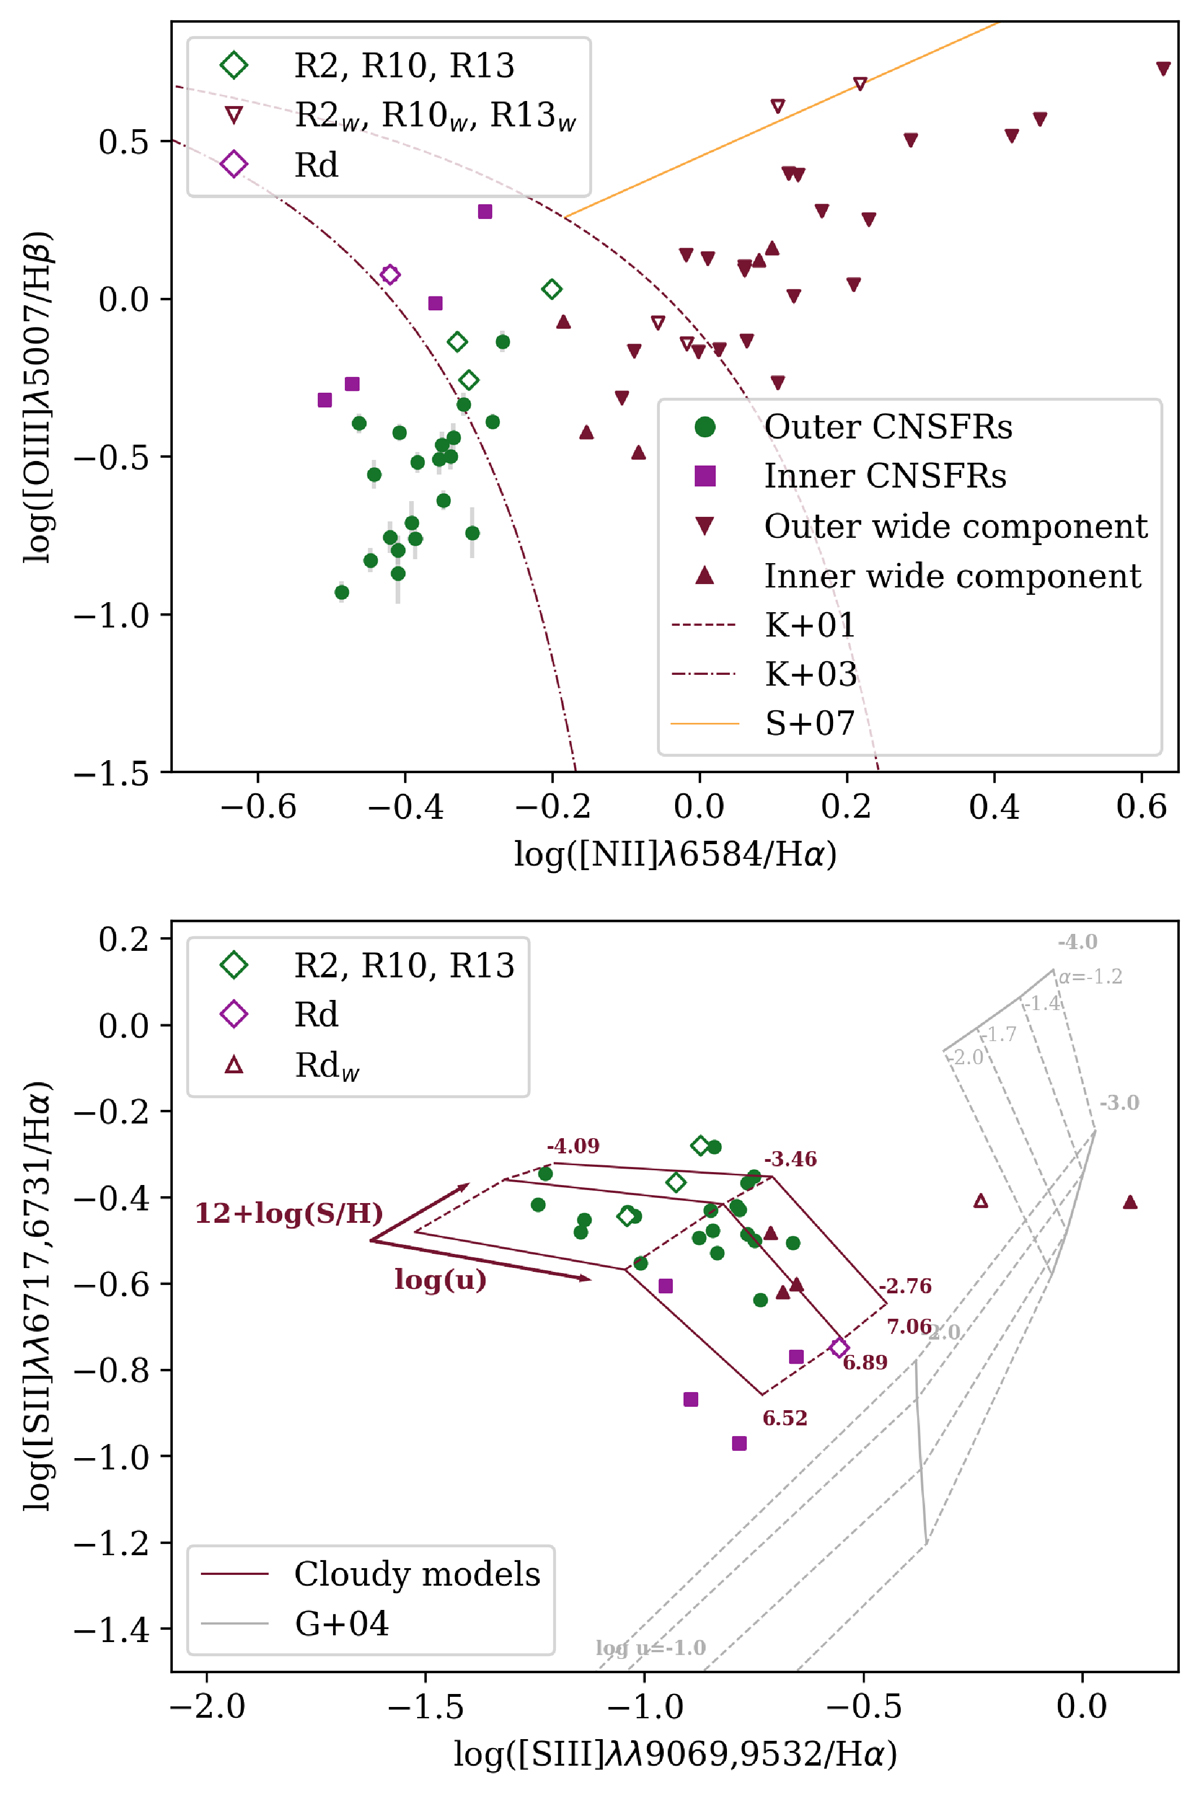
Fig. 14.
Download original image
Ionisation nature diagnostics. Upper panel: [OIII]/Hβ vs. [NII]/Hα diagnostic diagram. Overplotted are the derived separations between LINER/Seyfert (S+07, Schawinski et al. 2007) and HII regions (K+01 and K+03, Kewley et al. 2001; Kauffmann et al. 2003). Lower panel: [SII]/Hα – [SIII]/Hα diagnostic diagram. Overplotted are the dust-free AGN photo-ionisation models (G+04, Groves et al. 2004).
Current usage metrics show cumulative count of Article Views (full-text article views including HTML views, PDF and ePub downloads, according to the available data) and Abstracts Views on Vision4Press platform.
Data correspond to usage on the plateform after 2015. The current usage metrics is available 48-96 hours after online publication and is updated daily on week days.
Initial download of the metrics may take a while.