Fig. 16
Download original image
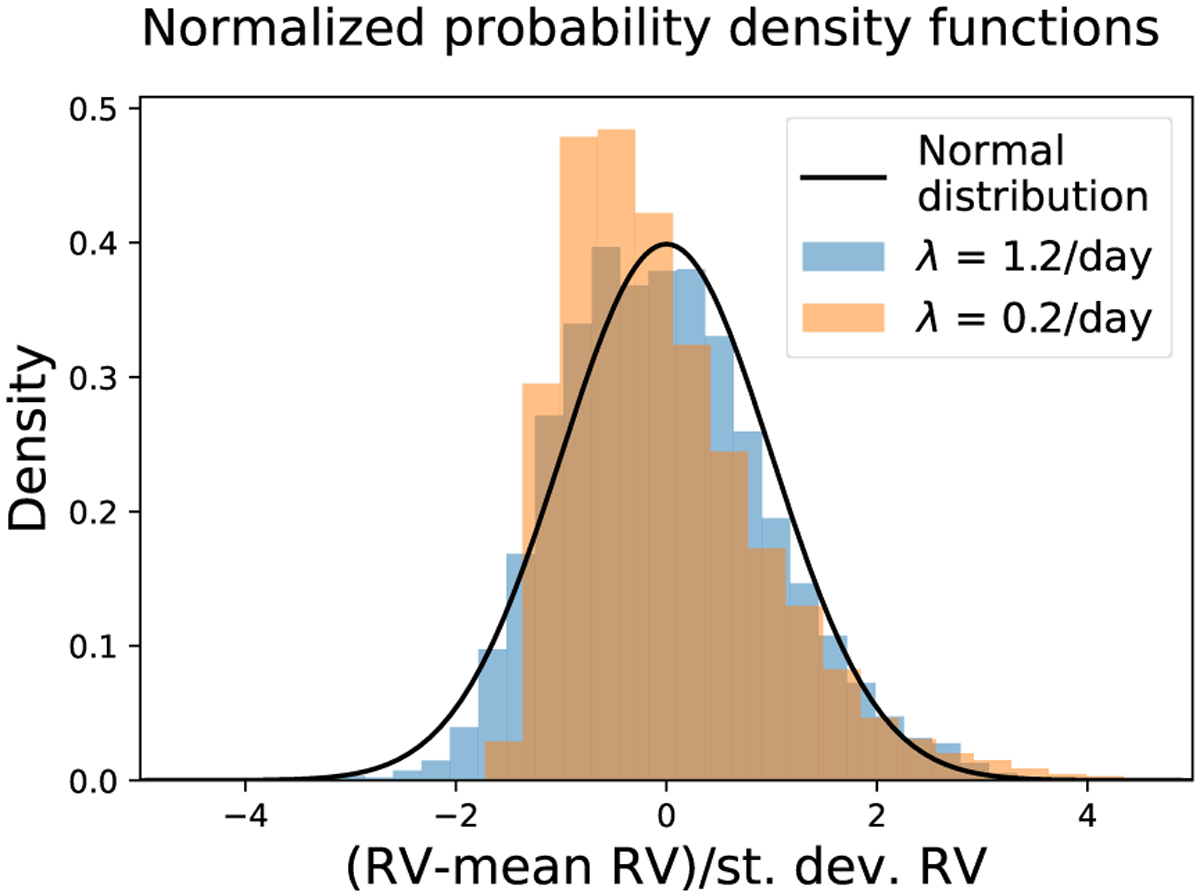
Histogram of normalized RVs simulated with a FENRIR process, with a rate of λ = 1.2 and λ = 0.2 magnetic region appearing per day (respectively the blue and orange histograms). RVs are normalized by subtracting the mean of the time-series and dividing by its empirical standard deviation. The black line represents a Gaussian distribution with vanishing mean and variance 1.
Current usage metrics show cumulative count of Article Views (full-text article views including HTML views, PDF and ePub downloads, according to the available data) and Abstracts Views on Vision4Press platform.
Data correspond to usage on the plateform after 2015. The current usage metrics is available 48-96 hours after online publication and is updated daily on week days.
Initial download of the metrics may take a while.