Fig. A.2.
Download original image
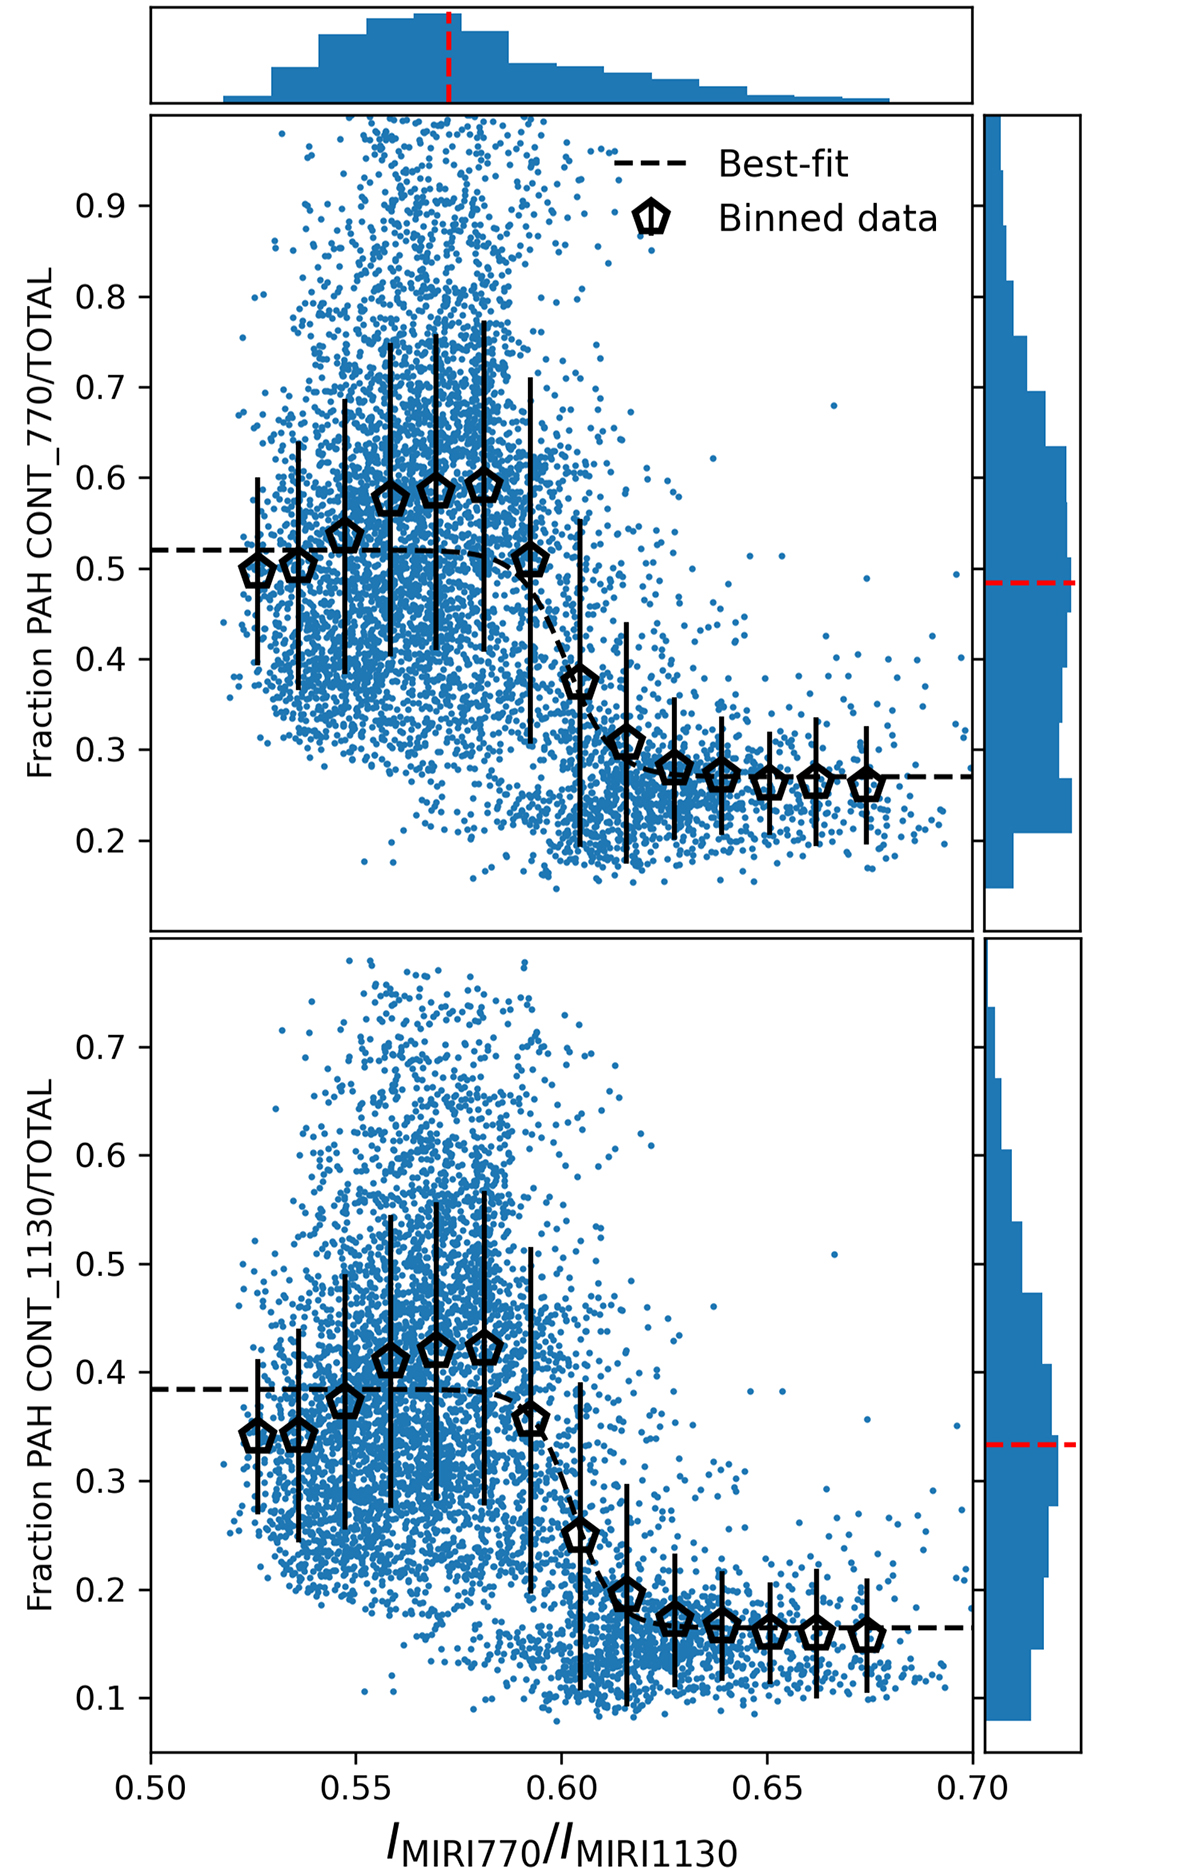
Continuum-to-total emission fraction at 7.7 μm (top) and at 11.3 μm (bottom) versus IMIRI770/IMIRI1130. While empty pentagons correspond to the data binned in the x-axis, the black-dashed lines are the best-fit functions to such binned data. Although with some scatter, at first order the distributions of the points are well described by the model α − β/(1 + e−γ(IMIRI770/IMIRI1130 − ρ)). The top and right histograms in both panels correspond to the distribution of the values for the respective axes, and the red-dashed lines mark the median of such distributions.
Current usage metrics show cumulative count of Article Views (full-text article views including HTML views, PDF and ePub downloads, according to the available data) and Abstracts Views on Vision4Press platform.
Data correspond to usage on the plateform after 2015. The current usage metrics is available 48-96 hours after online publication and is updated daily on week days.
Initial download of the metrics may take a while.