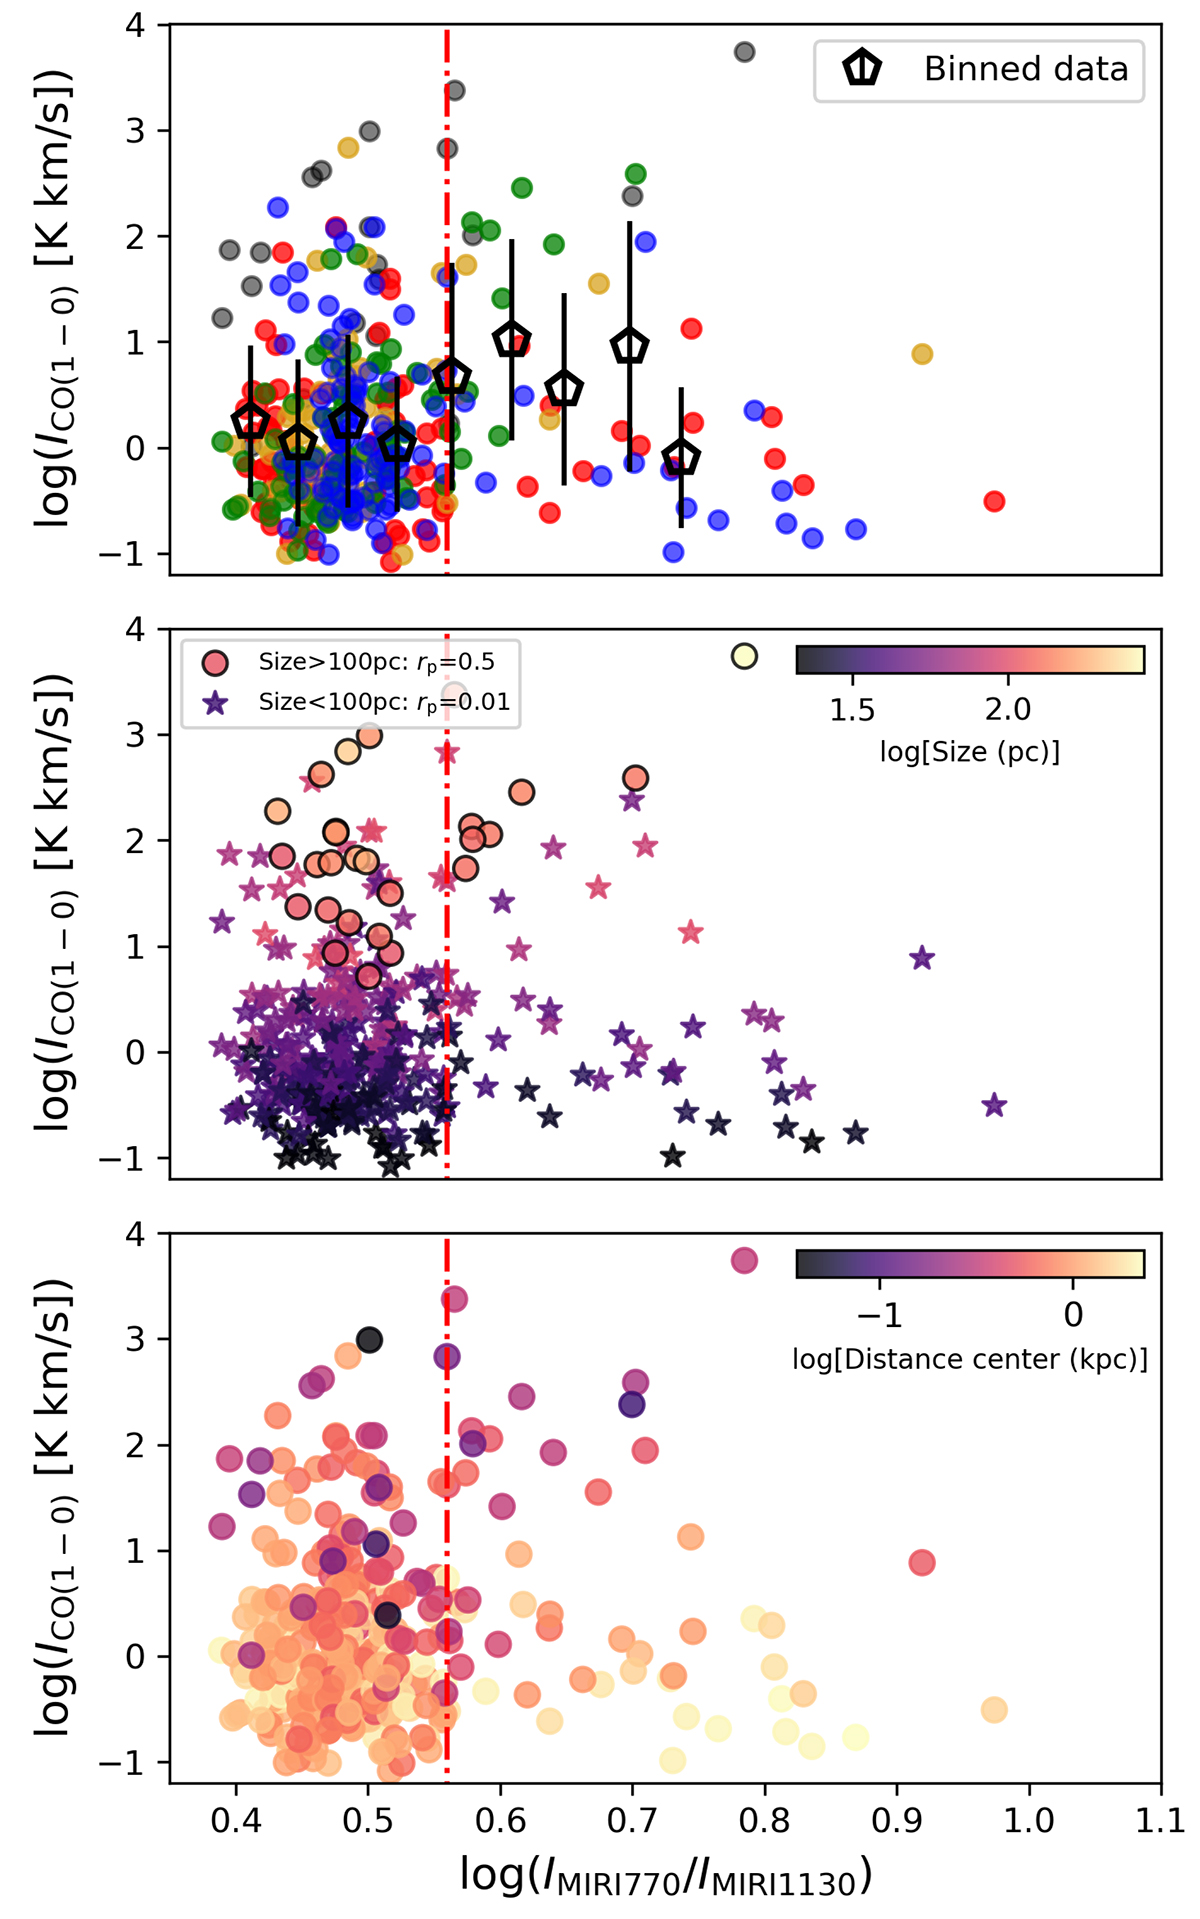
Fig. 4.
Download original image
ICO(1 − 0) versus IMIRI770/IMIRI1130 ratio. Top: symbols follow the same convention as in Fig. 3. Middle: symbols are colorcoded by the size of the CO cloud derived in Section 3.2; while circles are CO clouds with size larger than 100 pc, stars correspond to those smaller than this limit. The legend on the bottom panel contains the values of the Pearson rp for the two groups. The vertical dashed-dotted red lines mark the point log(IMIRI770/IMIRI1130)≈0.56 where the scatter of the CO–F770W/F1130W relationship increases significantly (see Section 4.2). Bottom: same as middle panel but colorcoded by the projected distance of the CO cloud respect to the optical center.
Current usage metrics show cumulative count of Article Views (full-text article views including HTML views, PDF and ePub downloads, according to the available data) and Abstracts Views on Vision4Press platform.
Data correspond to usage on the plateform after 2015. The current usage metrics is available 48-96 hours after online publication and is updated daily on week days.
Initial download of the metrics may take a while.