Fig. 1.
Download original image
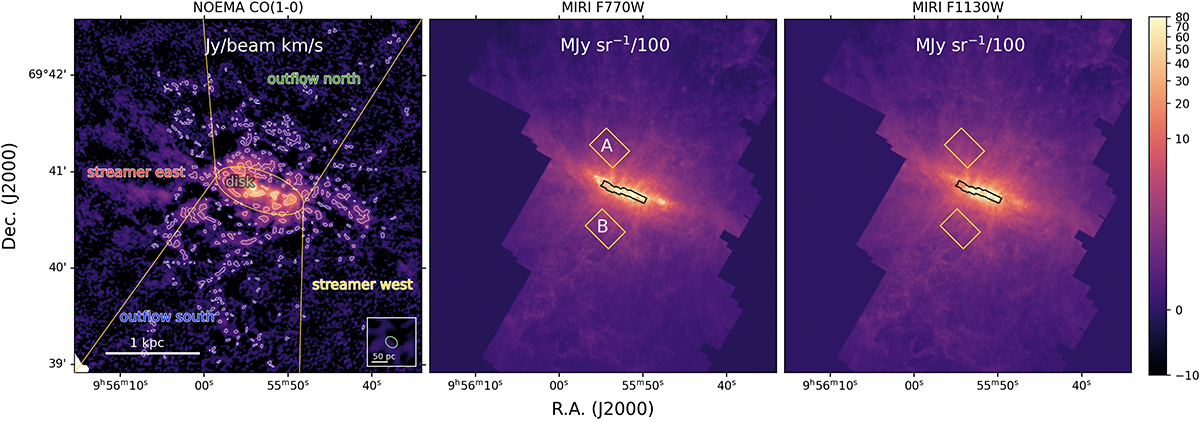
From left to right: M 82 NOEMA CO(J = 1 − 0), MIRI-F770W, and MIRI-F1130W images in cutouts of 5′×4.2′. The left panel also contains the molecular clouds identified in Section 3.2 (white contours), the centroid of the CO(J = 1 − 0) and the different regions identified in the starburst as described in Krieger et al. (2021). The inset in the left panel correspond to the NOEMA beamsize at ν = 115 GHz. The green crosses in the middle and right panels are indicate the optical center of M 82. The black contours in the middle and right panels correspond to the regions covered by the MIRI-MRS and the yellow boxes are the regions with Spitzer IRS data from Beirão et al. (2008); both are used in this work to apply a first-order continuum subtraction (see Section 3.1).
Current usage metrics show cumulative count of Article Views (full-text article views including HTML views, PDF and ePub downloads, according to the available data) and Abstracts Views on Vision4Press platform.
Data correspond to usage on the plateform after 2015. The current usage metrics is available 48-96 hours after online publication and is updated daily on week days.
Initial download of the metrics may take a while.