Open Access
Fig. A.2.
Download original image
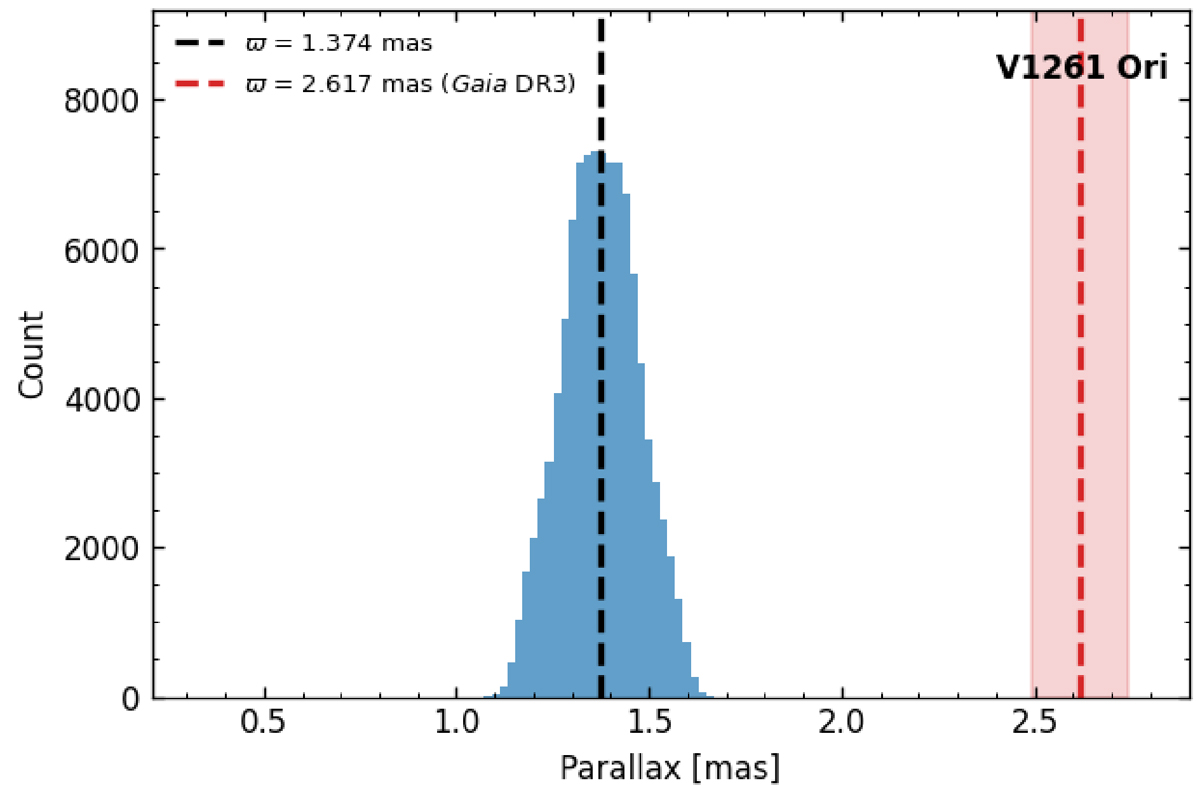
Parallaxes from our simulations of astrometric data of V1261 Ori. In each of the 100 000 iterations, the orbital orientation and time of periastron passage were varied randomly. The input parallax is indicated by the dashed black line, while the parallax from the Gaia DR3 catalog is marked by the dashed red line.
Current usage metrics show cumulative count of Article Views (full-text article views including HTML views, PDF and ePub downloads, according to the available data) and Abstracts Views on Vision4Press platform.
Data correspond to usage on the plateform after 2015. The current usage metrics is available 48-96 hours after online publication and is updated daily on week days.
Initial download of the metrics may take a while.