Fig. 5.
Download original image
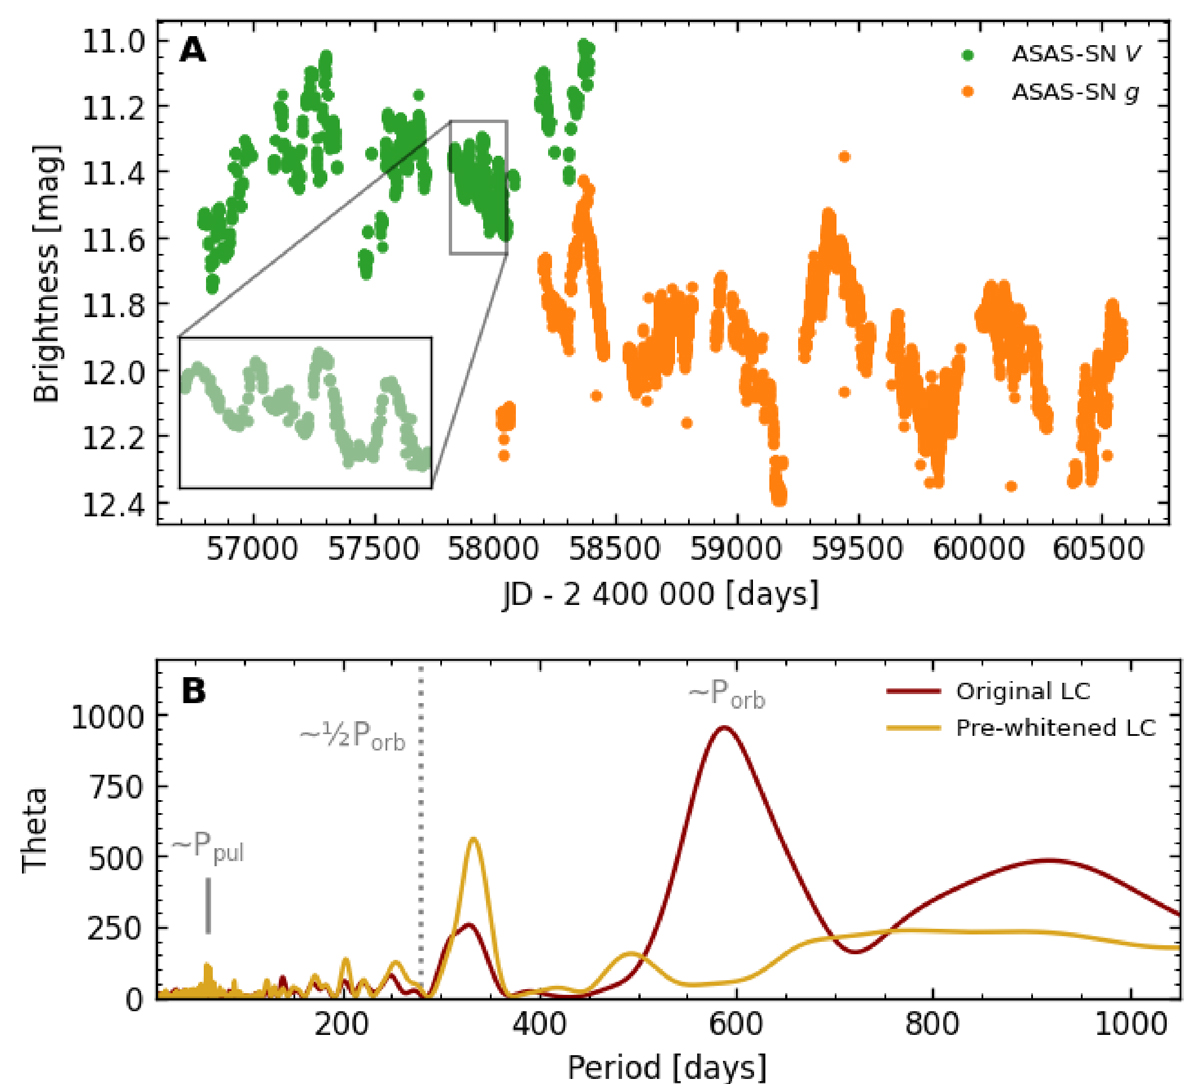
ASAS-SN light curve of V399 Pav. A: Light curves in V and g bands (in green and orange, respectively), with a zoomed-in section highlighting the pulsations. B: Results of the period analysis for the combined V- and g-band light curves (dark red) and for the pre-whitened light curve after removing the dominant period (dark yellow).
Current usage metrics show cumulative count of Article Views (full-text article views including HTML views, PDF and ePub downloads, according to the available data) and Abstracts Views on Vision4Press platform.
Data correspond to usage on the plateform after 2015. The current usage metrics is available 48-96 hours after online publication and is updated daily on week days.
Initial download of the metrics may take a while.