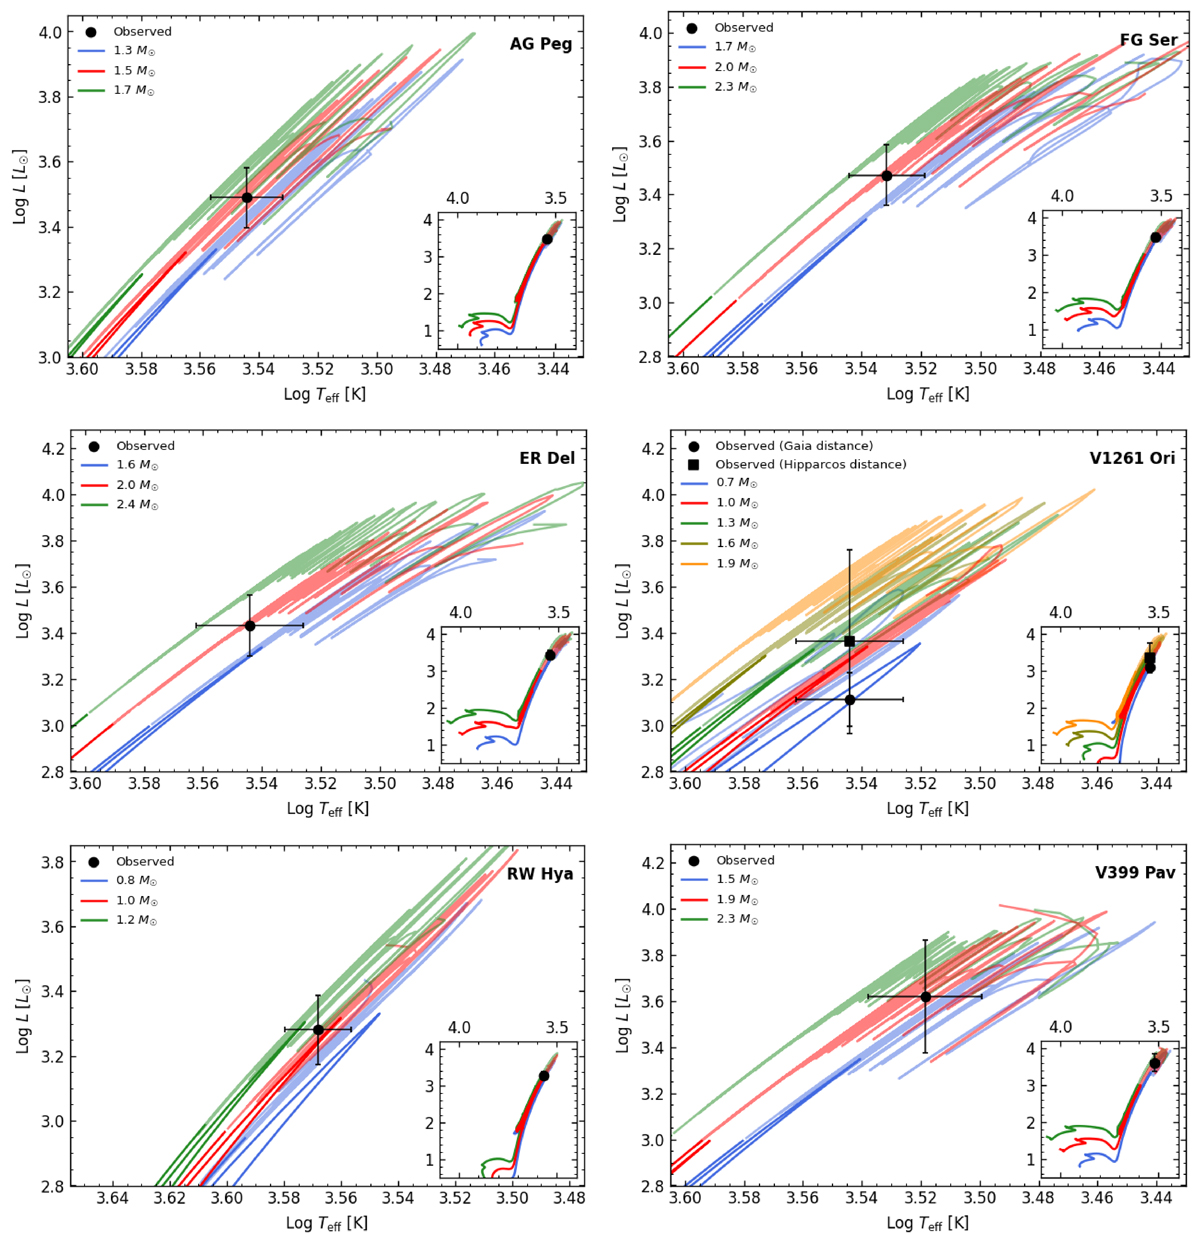
Fig. 3.
Download original image
Position of target stars in the H–R diagram. For each star, three selected MESA evolutionary tracks (Paxton et al. 2011; Dotter 2016; Choi et al. 2016) are shown (in green, red, and blue), calculated for the specific metallicity of the star. The evolution before and during the first RGB is represented in darker shades, while the AGB evolution is depicted in lighter shades. The post-AGB evolution is omitted for clarity.
Current usage metrics show cumulative count of Article Views (full-text article views including HTML views, PDF and ePub downloads, according to the available data) and Abstracts Views on Vision4Press platform.
Data correspond to usage on the plateform after 2015. The current usage metrics is available 48-96 hours after online publication and is updated daily on week days.
Initial download of the metrics may take a while.