Open Access
Fig. 2.
Download original image
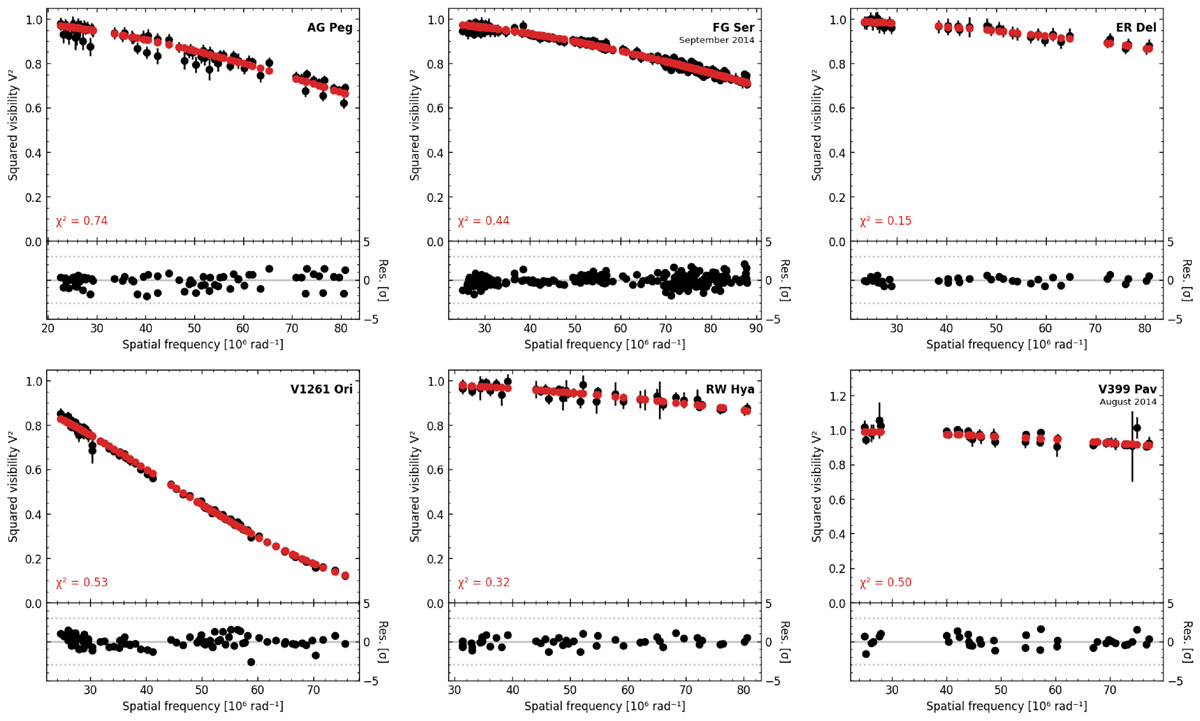
VLTI/PIONIER squared visibilities as a function of spatial frequency for the target stars. Observed data are represented in black, with the best-fitting model displayed in red. For stars with multiple observations, only one epoch is shown.
Current usage metrics show cumulative count of Article Views (full-text article views including HTML views, PDF and ePub downloads, according to the available data) and Abstracts Views on Vision4Press platform.
Data correspond to usage on the plateform after 2015. The current usage metrics is available 48-96 hours after online publication and is updated daily on week days.
Initial download of the metrics may take a while.