Fig. 6
Download original image
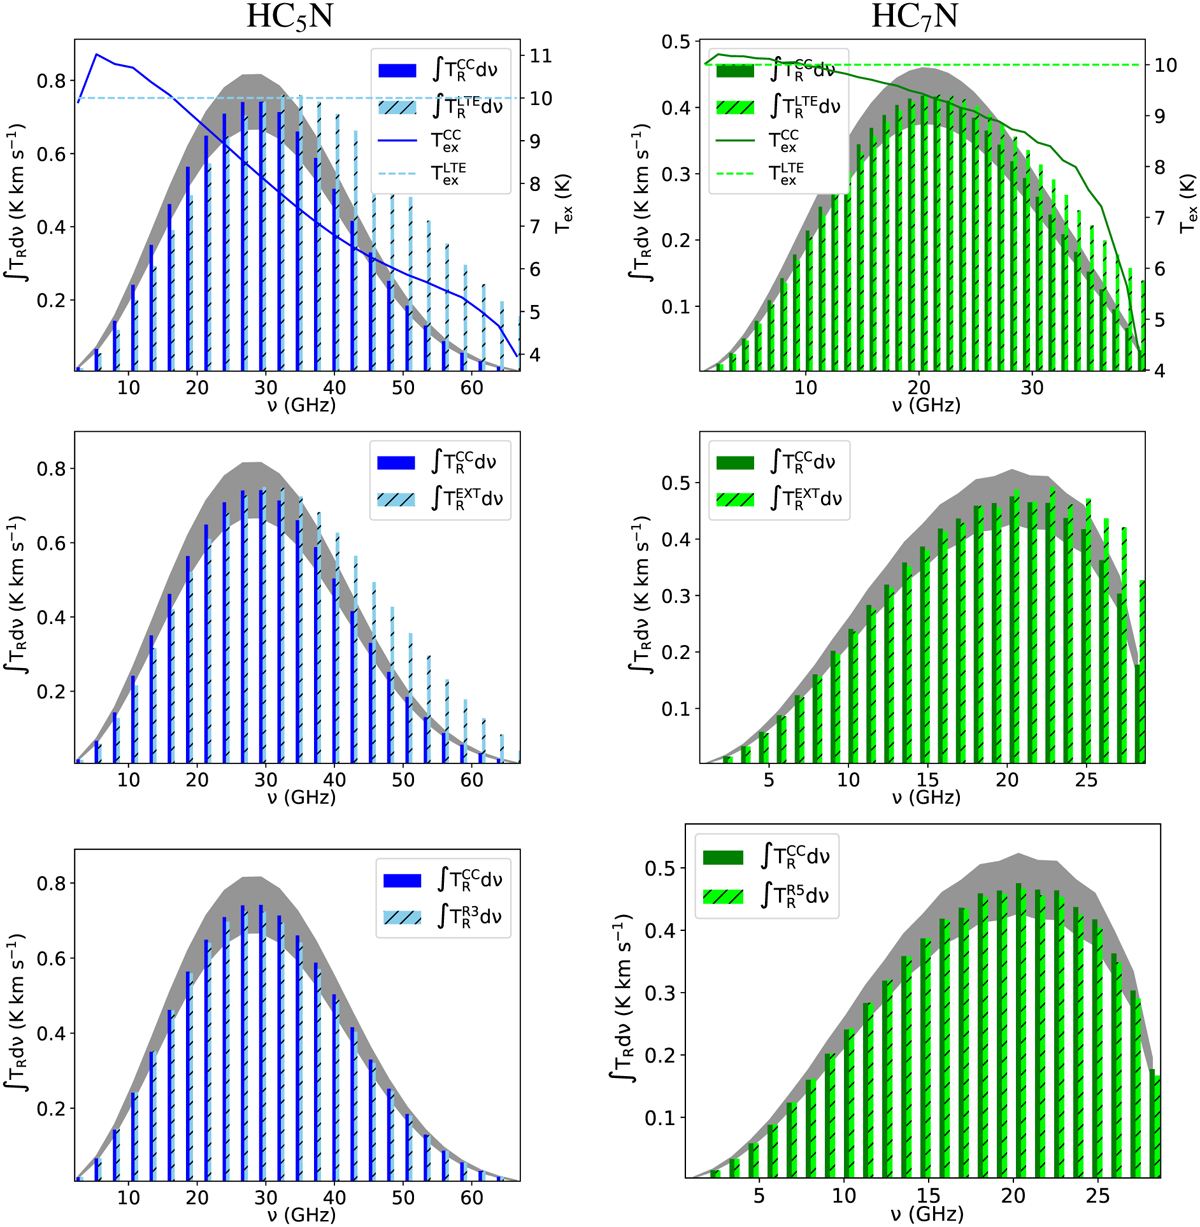
Sensitivity of the HC5N and HC7N line intensities to the accuracy of collisional rate coefficients. Each panel shows the line intensities (∫ TRdυ) and excitation temperatures (Tex) of emission lines as a function of frequency. The physical conditions employed in the calculations are n(H2) = 104 cm−3 and T = 10 K. The superscripts ‘CC’ refers to the close-coupling method used in the calculation of the collisional rate coefficients, whereas ‘R3’ and ‘R5’ denote when we employed the HC3N rate coefficients as template for those of HC5N and the scattering data for HC5N as a proxy for HC7N, respectively. The superscript ‘LTE’ means that the line intensities were derived considering LTE conditions. The shaded region stands for an agreement of 10% with the intensities calculated using CC reference data.
Current usage metrics show cumulative count of Article Views (full-text article views including HTML views, PDF and ePub downloads, according to the available data) and Abstracts Views on Vision4Press platform.
Data correspond to usage on the plateform after 2015. The current usage metrics is available 48-96 hours after online publication and is updated daily on week days.
Initial download of the metrics may take a while.