Fig. 5
Download original image
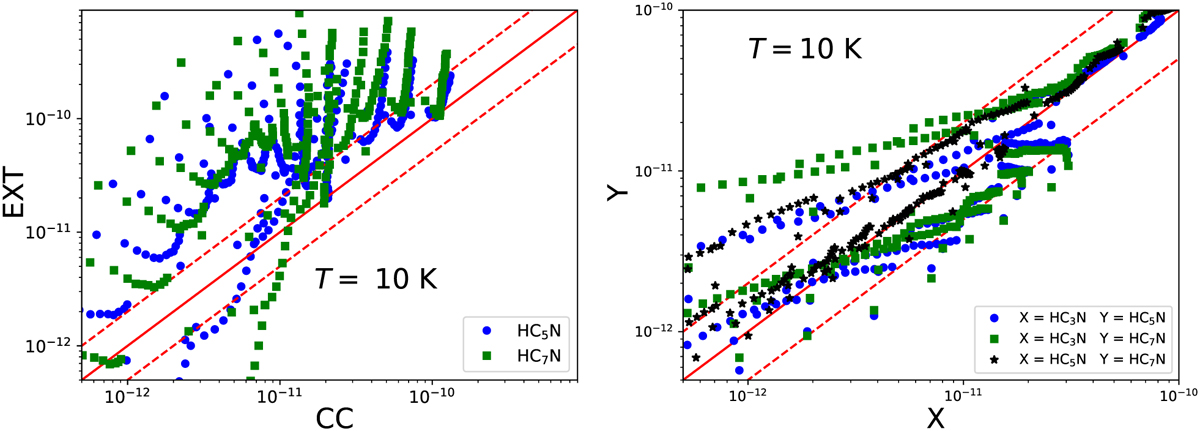
Assessment of the deviation of the collisional rate coefficients (in units of cm3 s−1). The left-hand panel shows the discrepancies generated by the extrapolation method relative to the close-coupling scattering data computed in this work. The right-hand panel compares the HC3N and HC5N, HC3N, and HC7N, and HC5N and HC7N CC rate coefficients. The solid line represents a 1:1 ratio, while the dashed lines delimit a region where the agreement is within a factor of two.
Current usage metrics show cumulative count of Article Views (full-text article views including HTML views, PDF and ePub downloads, according to the available data) and Abstracts Views on Vision4Press platform.
Data correspond to usage on the plateform after 2015. The current usage metrics is available 48-96 hours after online publication and is updated daily on week days.
Initial download of the metrics may take a while.