Fig. 4
Download original image
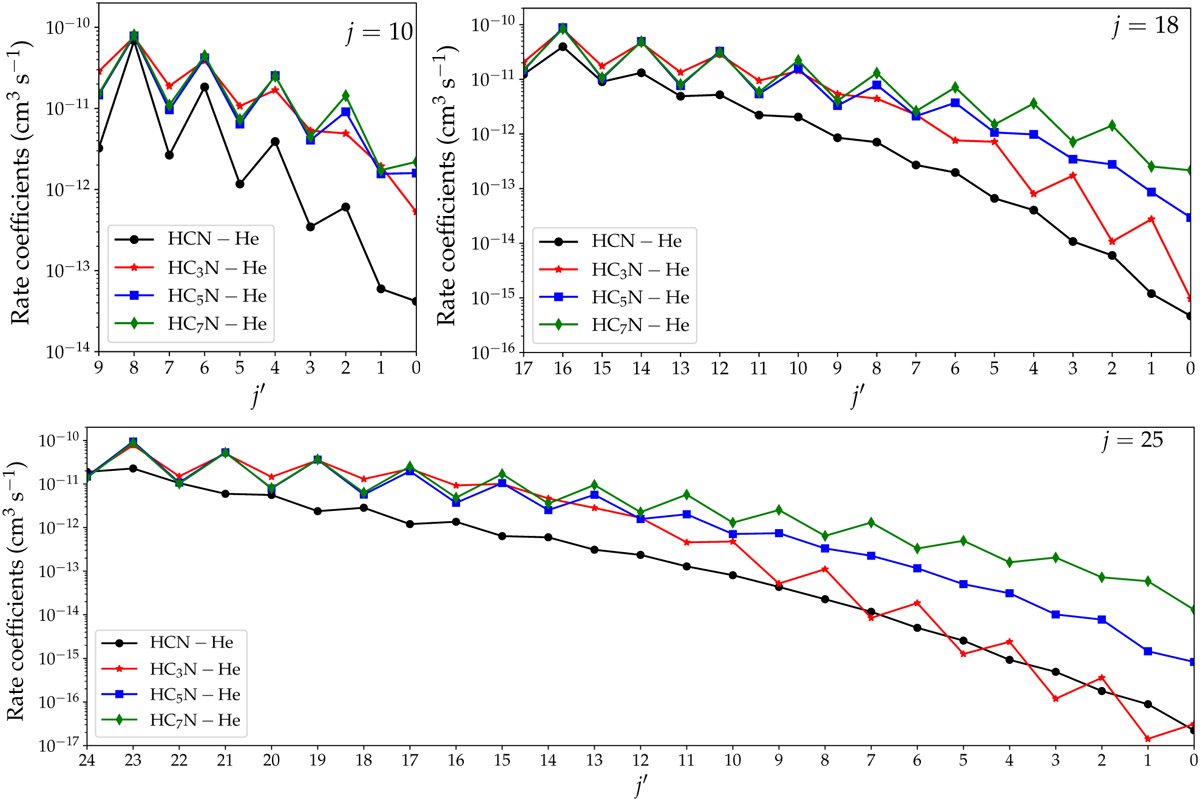
Comparison of the HCN, HC3N, HC5N, and HC7N rate coefficients induced by collisions with He for a kinetic temperature of 10 K. Each panel shows downward transitions out of the indicated rotational level. The data for HCN were computed by Dumouchel et al. (2010). All data shown in this plot were calculated using the close-coupling quantum mechanical approach.
Current usage metrics show cumulative count of Article Views (full-text article views including HTML views, PDF and ePub downloads, according to the available data) and Abstracts Views on Vision4Press platform.
Data correspond to usage on the plateform after 2015. The current usage metrics is available 48-96 hours after online publication and is updated daily on week days.
Initial download of the metrics may take a while.