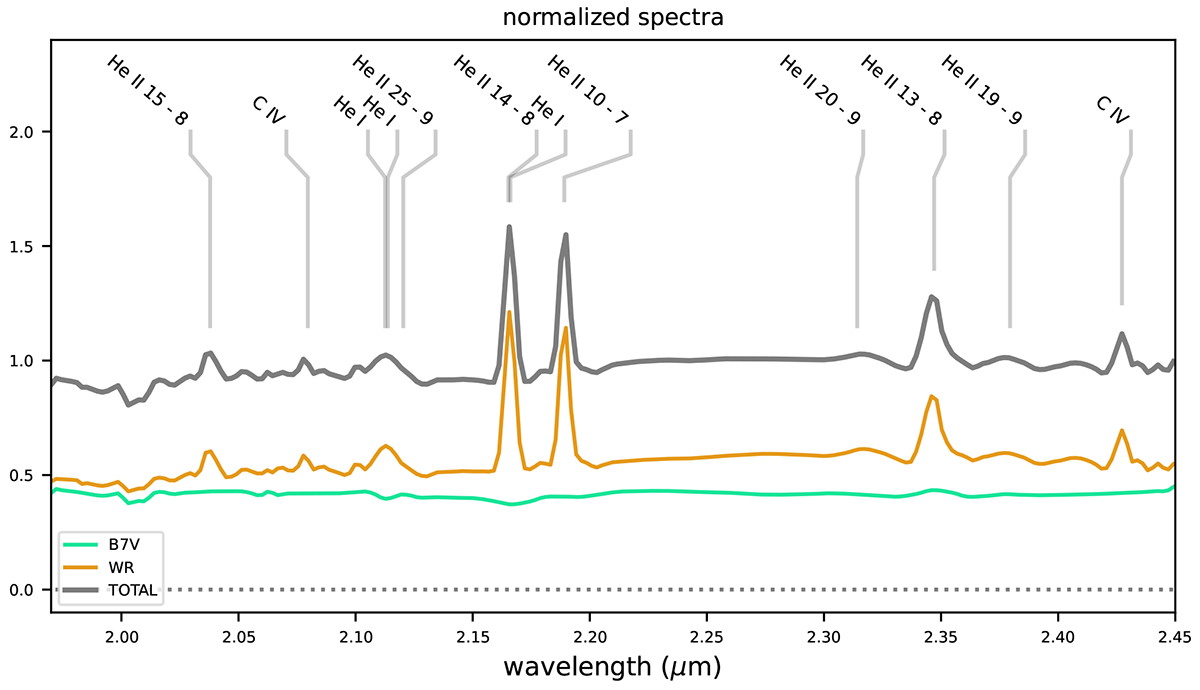
Fig. 2.
Download original image
Derived normalized spectra in the K-band from the GRAVITY data using the SCI-FREE calibration approach. The orange spectrum represents the qWR primary, the green one represents the B7 V secondary, and the gray one represents their sum. Expected emission lines for the qWR are listed based on the GRAVITY NFLUX data shown in Figure 1.
Current usage metrics show cumulative count of Article Views (full-text article views including HTML views, PDF and ePub downloads, according to the available data) and Abstracts Views on Vision4Press platform.
Data correspond to usage on the plateform after 2015. The current usage metrics is available 48-96 hours after online publication and is updated daily on week days.
Initial download of the metrics may take a while.