Fig. C.1.
Download original image
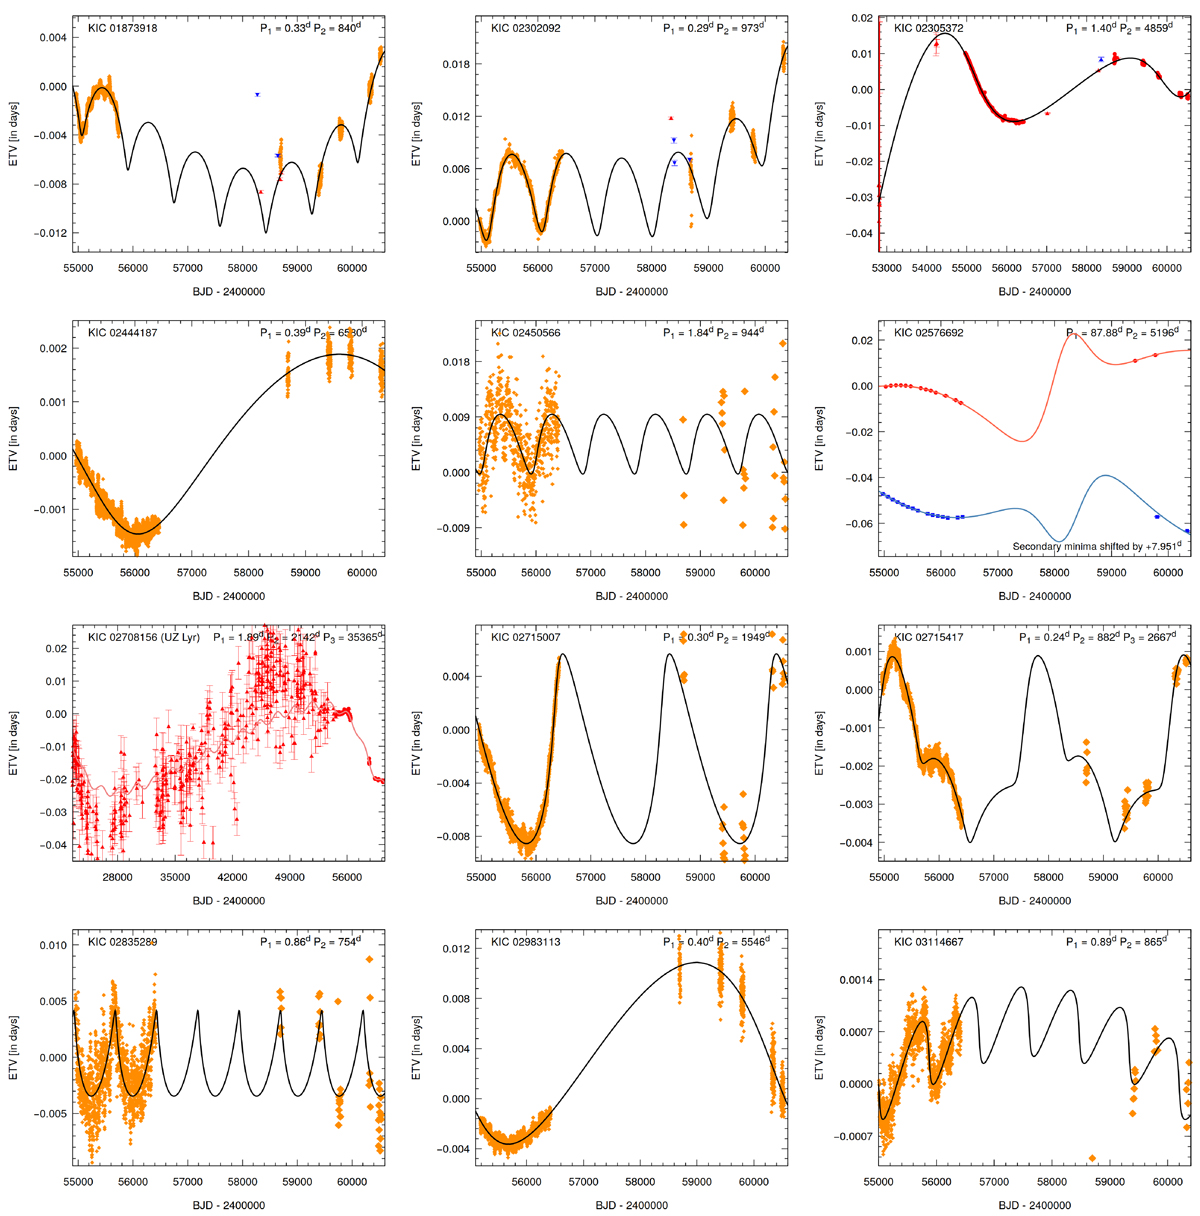
ETVs with third body solutions. ETV curves calculated from satellite observations of primary and secondary minima, and the average of the two, are denoted by red circles, blue boxes, and orange diamonds, respectively. (Where normal minima were used, these are denoted with larger sized symbols). We display and fit the ETV curves for both the primary and secondary eclipses only when the data quality warrant a joint analysis and the binary is eccentric. If the primary and secondary ETV curves are of comparable quality and the binary eccentricity is nearly zero, we display and fit only the average of the two ETV curves. If the quality of the primary ETV curve is significantly better than that of the secondary curve or, if only primary eclipses are present, we present only the plot and the fit for the primary eclipses. Ground-based minima (taken from either the literature, or our own follow-up observations, and available only for a few systems) are denoted by upward red triangles (primary) and downward blue triangles (secondary); their estimated uncertainties are also indicated. Pure LTTE solutions are plotted with black lines, while combined dynamical and LTTE solutions are drawn with grey lines. (Note, the use of quadratic or cubic terms is not indicated; for these and other details, see Table A.2–A.7
Current usage metrics show cumulative count of Article Views (full-text article views including HTML views, PDF and ePub downloads, according to the available data) and Abstracts Views on Vision4Press platform.
Data correspond to usage on the plateform after 2015. The current usage metrics is available 48-96 hours after online publication and is updated daily on week days.
Initial download of the metrics may take a while.