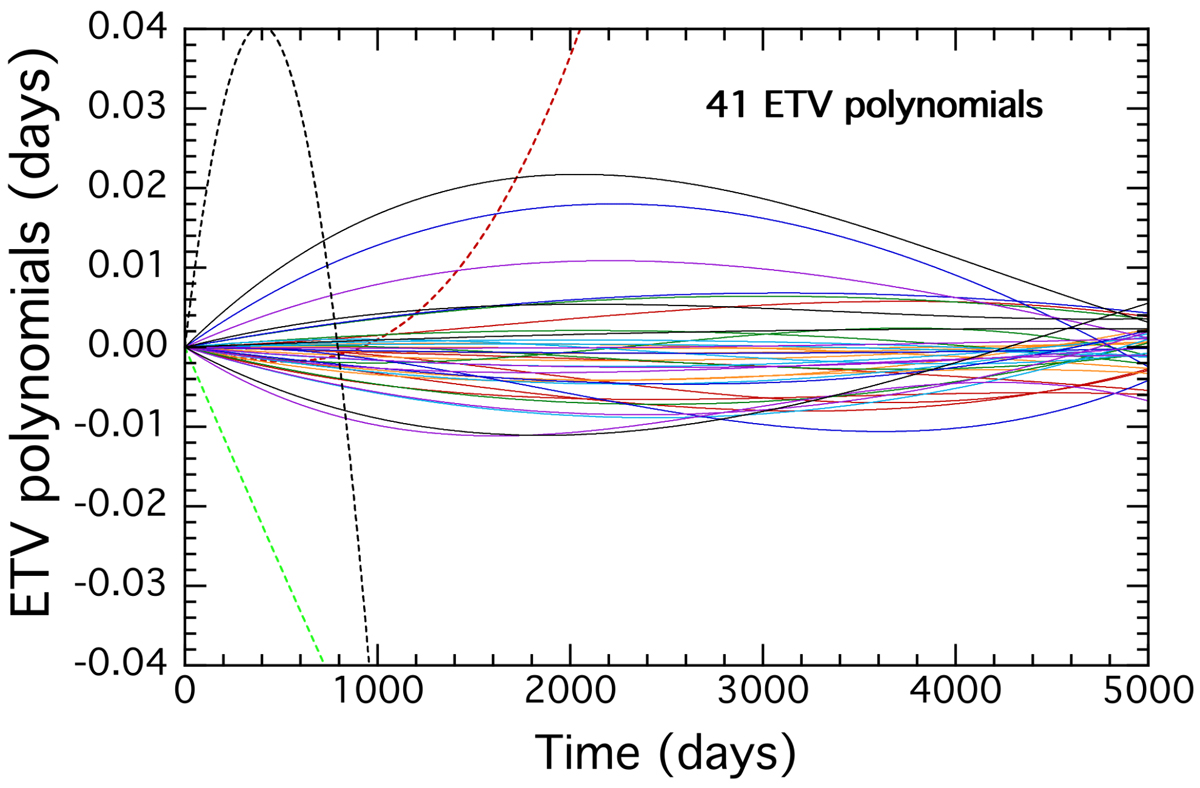
Fig. 10.
Download original image
ETV residuals fit to quadratic and cubic polynomials. These are taken from 41 secure LTTE and LTTE + DE fits. They are continuous reconstructions over a 5000 day interval (spanning the Kepler and current TESS missions) using the polynomial coefficients that were part of the fitting process. The colours are merely to help the eye separate the different curves. The three curves shown as dashed lines that go off the scale of the plot likely represent higher-order terms that are not captured by the analytic formulae used to fit the ETV curves.
Current usage metrics show cumulative count of Article Views (full-text article views including HTML views, PDF and ePub downloads, according to the available data) and Abstracts Views on Vision4Press platform.
Data correspond to usage on the plateform after 2015. The current usage metrics is available 48-96 hours after online publication and is updated daily on week days.
Initial download of the metrics may take a while.