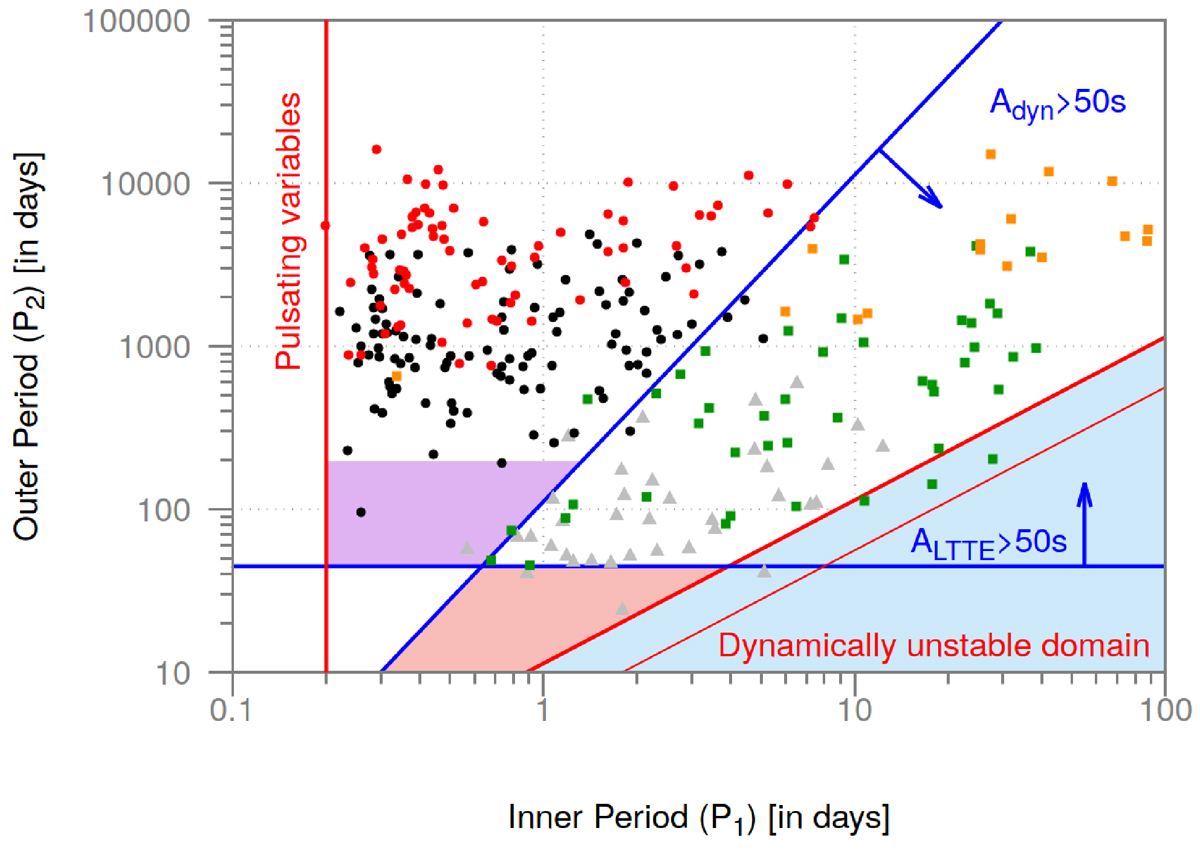
Fig. 1.
Download original image
Locations of the analysed hierarchical triple star candidates, together with other triply eclipsing triples, detected with space telescopes Kepler and TESS in the P1 − P2 plane. Black and red dots and green and orange squares represent the current TESS revisited Kepler candidates. For the black and red systems simple LTTE solutions were satisfactory, while for the green and orange ones, the DEs were also taken into account. (The red and orange symbols, however, denote the most uncertain solutions which were largely omitted from the statistical investigations.) The grey triangles represent recently discovered K2 and TESS systems with accurately known photodynamical solutions. (These are mostly triply eclipsing triple systems.) The vertical red line at the left shows the lower limit of the period of overcontact binaries. The horizontal and sloped blue lines are boundaries that roughly separate detectable ETVs from the undetectable ones. The detection limits again, were set to 50 s. These amplitudes were calculated following the same assumptions as in Fig. 8 of Borkovits et al. (2016), i.e. mA = mB = mC = 1 M⊙, e2 = 0.35, i2 = 60°, ω2 = 90°. The arrows indicate the directions of increasing LTTE and dynamical amplitudes. The shaded regions from left to right represent (i) the W UMa desert, i.e. the (almost) empty domain (purple) where a tight third companion of a short-period EB would certainly be detectable through its LTTE, even in the absence of measurable dynamical delays; (ii) the purely dynamical region (pale orange), i.e. where the DE should be detectable, while the LTTE not and; (iii) the dynamically unstable region (light blue) in the sense of the Mardling & Aarseth (2001) formula. Note that while the border of this latter shaded area was also calculated with e2 = 0.35, we give the limit for e2 = 0.1, as the thinner red line within this (light blue) region, as well.
Current usage metrics show cumulative count of Article Views (full-text article views including HTML views, PDF and ePub downloads, according to the available data) and Abstracts Views on Vision4Press platform.
Data correspond to usage on the plateform after 2015. The current usage metrics is available 48-96 hours after online publication and is updated daily on week days.
Initial download of the metrics may take a while.