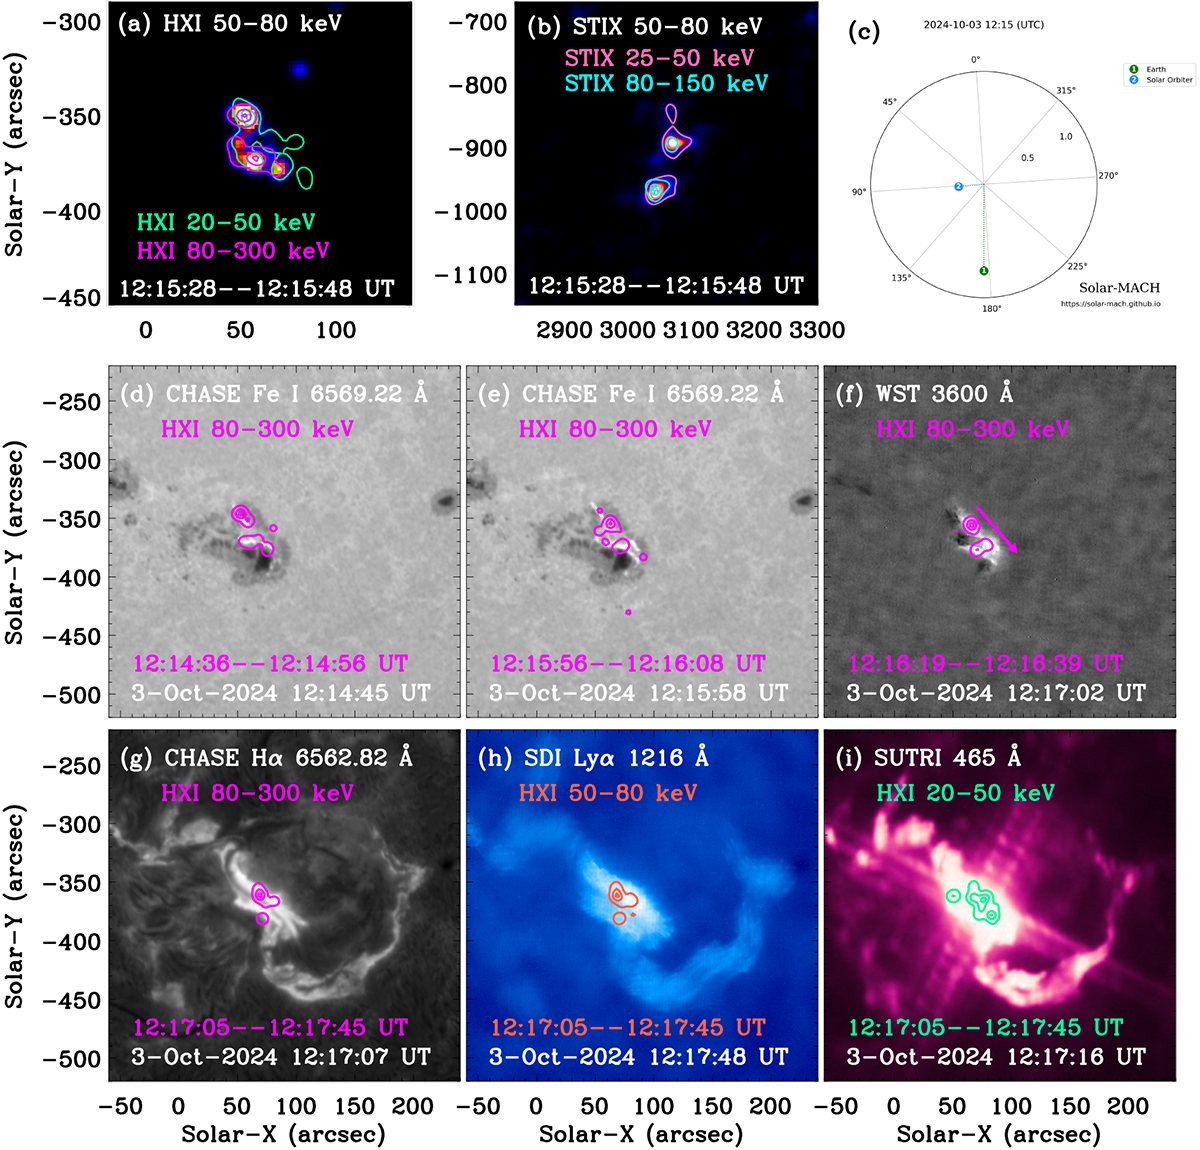
Fig. 4.
Download original image
Multiwavelength images during the X9.0 flare. (a and b): HXR maps restructured from the HXI and STIX observational data. (c) Sketch plot of the spatial location of STIX and its connection with the Sun and Earth at 12:15 UT on October 3, 2024. (d–f) White-light sub-maps measured by CHASE Fe I and WST 3600 Å. The magenta arrow indicates the movement direction of HXR sources. (g and h): Hα and Lyα images observed by CHASE and SDI. (i): The EUV snapshot captured by SUTRI at 465 Å. The contour levels are set at 10%, 50%, and 90%, respectively.
Current usage metrics show cumulative count of Article Views (full-text article views including HTML views, PDF and ePub downloads, according to the available data) and Abstracts Views on Vision4Press platform.
Data correspond to usage on the plateform after 2015. The current usage metrics is available 48-96 hours after online publication and is updated daily on week days.
Initial download of the metrics may take a while.